Menu
Feature and product adoption

Feature Adoption Rate for B2B SaaS: Formula, Denominator, and Examples

Calculate feature adoption rate for B2B SaaS with the right denominator, behavior threshold, time window, and account-level examples.

Feature adoption rate is the percentage of eligible active accounts or users that meet a predefined behavior threshold for a feature within a stated measurement window. The arithmetic is simple; the definition is not. In B2B SaaS, “40% adoption” could mean that 40% of accounts opened a Reporting page, 40% of eligible users completed and saved a report, or 40% of initial adopters returned in a later period. Those are different metrics and support different decisions.

A defensible rate names four things before anyone sees the result: the measured entity, the eligible denominator, the qualifying behavior, and the time window. The basic account formula is adopting eligible active accounts divided by eligible active accounts; the user version substitutes users. A page open is a useful discovery or reach signal, but it is not automatically meaningful adoption.

What is feature adoption rate?

Feature adoption rate measures the breadth of qualifying feature use across a defined population. It does not measure total event volume, time spent, satisfaction, business impact, or how deeply each adopter uses the feature. This distinction keeps SaaS feature adoption and other product feature adoption metrics tied to the questions they can actually answer.

A general feature adoption rate formula is:

Feature adoption rate

Distinct eligible entities that meet the adoption threshold during the measurement window ÷ distinct eligible entities with an opportunity to adopt during the same window × 100

Three details in that formula matter:

  • Distinct entities: an account or user is counted once, even if it performs the action many times.
  • Eligible population: the numerator must be a subset of the denominator.
  • Same window: access, activity, and qualifying behavior must be evaluated using compatible time rules.

The generic formula becomes useful only after “entity,” “eligible,” “adoption threshold,” and “window” have operational definitions. A dashboard cannot repair an ambiguous definition after the calculation has been made.

The four parts of every adoption definition

1. Entity being measured

Choose the entity that matches the product decision.

Use an account when the question is whether customer organizations have reached or incorporated the feature. Use a user when the question is whether the relevant people have used it. For some collaborative workflows, an account threshold may require more than one participating user or more than one role.

Do not switch between accounts and users inside one ratio. “Accounts using the feature divided by active users” is not an adoption rate with a meaningful interpretation.

2. Eligible denominator

Eligibility is not the same as existence in the database.

An account may be ineligible because its plan does not include the feature, prerequisite setup is incomplete, it is still in an onboarding grace period, or the feature does not apply to its use case. A user may lack the required role or permission even when the account has access.

The denominator should represent entities that could reasonably have adopted during the window.

3. Qualifying behavior

The qualifying behavior should correspond to the question the team is trying to answer.

Opening a page measures discovery or reach. Starting configuration measures intent. Completing a workflow or saving, sharing, exporting, or publishing its output may be a stronger signal of meaningful use. Repeating the behavior in separate sessions or periods can show that usage extends beyond one trial.

Define this threshold before examining the result. Changing it after seeing the number turns measurement into result-shopping.

4. Measurement window

The window must give eligible entities enough opportunity to perform the behavior at the feature’s natural cadence.

Seven days may be adequate for a daily workflow but misleading for monthly reporting. A quarterly process may need a full business cycle or a trigger-based opportunity window. A newly released feature should usually be measured in cohorts that receive equal time to adopt.

A useful metric definition can be expressed in one sentence:

An eligible active account adopts Reporting when at least one permitted user completes a report and saves, shares, exports, or publishes the output during a 30-day window.

That sentence is more valuable than a generic label because another analyst can reproduce it.

Diagram showing entity, eligible denominator, qualifying behavior, and measurement window combining into a defensible feature adoption rate.
A feature adoption rate becomes reproducible only when the entity, eligibility rule, qualifying behavior, and time window are explicit.

Feature discovery, first use, meaningful use, and retained use are different

“Feature adoption” is often used as an umbrella term for several related signals. Separating them prevents one number from carrying more meaning than the data supports.

Feature adoption signals and the questions they can and cannot answer.
SignalDefinitionWhat it helps answerWhat it does not establish
Feature discoveryThe entity was exposed to the feature, reached its entry point, or opened its page.Did the eligible audience find or reach the feature?Whether it completed a useful task.
First useThe entity performed the first qualifying interaction for the first time.Did discovery lead to an initial attempt?Whether the feature became part of a workflow.
Account adoptionThe account met an account-level threshold, often through one or more eligible users.How broadly has the feature spread across customer organizations?How many people inside each account adopted it.
User adoptionAn eligible user met the user-level threshold.How broadly has the feature spread across the relevant people?Whether adoption is evenly distributed across accounts.
Meaningful useThe entity completed an action tied to the feature’s intended outcome.Did usage progress beyond entry or exploration?Whether the outcome was valuable, satisfactory, or causally important.
Repeated useAn initial adopter met the threshold again in a required number of distinct sessions or periods.Did usage extend beyond one trial?Long-term retention unless later cohorts are followed.
Depth or intensityThe amount, frequency, complexity, or range of usage among adopters.How much are adopters doing with the feature?How broad adoption is across the eligible population.
Retention of feature usageInitial adopters return to the qualifying behavior in later opportunity periods.Does the behavior persist after initial adoption?Why adopters returned or whether the feature caused a business result.

These signals are not always a strict linear funnel. Meaningful use can happen on a first visit. Repeated use can still be superficial. A user can explore a feature deeply once and never return. Report each signal for what it is.

Account adoption, user adoption, and penetration

B2B SaaS products usually need at least two entities: the customer account and the people inside it.

Account adoption rate

Account adoption rate

Eligible active accounts that meet the adoption threshold ÷ eligible active accounts × 100

An account is counted once whether one user or one hundred users meet the threshold. This makes account adoption useful for measuring spread across the customer portfolio, but it can hide champion concentration.

For a collaborative feature, define what makes the account an adopter. “At least one user completed the workflow” may be sufficient for an administrator-owned setup feature. It may be too weak for a collaboration feature whose value requires several participants.

User adoption rate

User adoption rate

Eligible active users who meet the adoption threshold ÷ eligible active users × 100

User adoption shows individual reach across the eligible user population. It can still hide account distribution: a large account with many adopters may dominate the total while most customer accounts remain untouched.

User penetration inside adopting accounts

User penetration inside adopting accounts

Distinct users who used the feature ÷ active users inside the accounts that adopted the feature × 100

Penetration asks a narrower question: once an account has adopted, how broadly has usage spread among its active users?

Keep the numerator aligned with the analytical threshold. If account adoption is defined by meaningful report completion, calculate meaningful-action penetration from users who meet that same threshold. If the feature is restricted to administrators, use eligible active administrators rather than every active user in the account.

Account adoption and penetration are complementary:

  • High account adoption with low penetration can indicate one-champion usage.
  • Lower account adoption with high penetration can indicate a feature that is valuable to a narrower set of accounts but spreads well inside them.
  • High values for both suggest broad inter-account and intra-account reach, but they still do not prove satisfaction or business value.

The distinction is useful, but it does not need to turn every B2B feature adoption analysis into a debate about which entity is universally better. The product decision determines which rate is primary.

Repeated-use rate

Repeated use is appropriate when adoption should involve a recurring workflow rather than one completion.

Repeated-use rate

Adopters who used the feature in at least the required number of distinct periods ÷ initial adopters × 100

The entity can be an account or user, but it must be explicit. The required periods must match product cadence. A daily workflow might use distinct days; weekly collaboration might use distinct weeks; monthly reporting might require separate reporting cycles.

Do not reuse one repeated-use rule for every feature.

Choosing the correct denominator

The most common feature adoption rate formula is simple enough to calculate in a spreadsheet. The denominator decision is where most interpretation errors begin, which is why any explanation of how to calculate feature adoption should start with eligibility rather than arithmetic.

All created accounts versus active accounts

“All created accounts” may include:

  • churned or closed customers;
  • accounts with no valid activity in the selected period;
  • test and internal accounts;
  • abandoned trials;
  • accounts that have never completed setup.

That population can be useful for a cumulative installed-base question, but it is usually a poor denominator for selected-period adoption.

For a period metric, start with accounts that had valid product activity in that period. Then apply the eligibility rules for the feature.

All users versus active users

A user record or paid seat does not prove that the person had an opportunity to use the feature. Invited users, deactivated users, service accounts, and people who never entered the product can distort the rate.

Use active users when the question concerns current product behavior. Define “active” consistently, such as at least one valid product visit during the selected period.

Eligible plans and entitlements

Exclude accounts and users whose plans cannot access the feature. Otherwise, a change in plan mix can look like a change in adoption even when behavior among entitled customers is stable.

Record whether eligibility is based on:

  • the plan at the start of the window;
  • the plan at the end of the window;
  • access at any time during the window; or
  • a minimum number of days with access.

For release cohorts, a minimum opportunity rule is often clearer than a simple calendar snapshot.

Eligible roles and permissions

An administrator-only feature should not be judged against every active user. A billing workflow may be relevant only to account owners or finance roles. A publishing action may be visible to many users but executable by only a few.

Use the people who can perform the action, not everyone who can see its surrounding page.

Prerequisite setup

Some features are unavailable or meaningless until an account:

  • connects a data source;
  • creates a project;
  • invites a collaborator;
  • configures an integration;
  • imports required data; or
  • completes an earlier workflow.

If the prerequisite is under the product team’s control, track prerequisite completion separately. Excluding those accounts from the feature denominator may produce a fair feature-adoption rate, but it must not make the prerequisite problem disappear.

Report both layers when necessary:

  1. the percentage of accounts that became eligible; and
  2. the percentage of eligible accounts that adopted.

New accounts still onboarding

A new account may technically have access but not yet have reached the point where the feature is relevant.

Choose a declared rule, such as:

  • exclude accounts until onboarding reaches a defined stage;
  • give each account a fixed number of days after first eligibility;
  • report new and established accounts separately; or
  • measure a dedicated onboarding cohort.

Do not silently move new accounts in and out of the denominator to improve the rate.

Optional or use-case-specific features

A global denominator can make a healthy niche feature appear weak.

An API-key workflow may be essential to integration-heavy customers and irrelevant to everyone else. A regional tax report may serve only a geographic segment. An advanced export may apply only to accounts with a particular downstream process.

Define the use-case cohort using observable account attributes or prerequisite behavior. Avoid using “people who eventually adopted” as the eligibility rule, because that makes the denominator depend on the outcome.

Users with permission to perform the action

Visibility and permission are separate. A user might view a report but be unable to publish it. If publishing is the qualifying behavior, only users with publishing permission belong in the user denominator.

The general integrity check is:

Every entity in the numerator must have been eligible for the denominator, and every entity in the denominator must have had a reasonable opportunity to meet the threshold.

Choosing a meaningful adoption event

The event should be strong enough for the decision without claiming more than it proves.

Candidate adoption behaviors and their interpretation limits.
Candidate behaviorWhat it indicatesTypical limitation
Page viewedThe page rendered or the user reached the route.Measures reach or discovery more reliably than value.
Feature openedThe user deliberately entered the feature.Entry can still end immediately.
Configuration startedThe user showed intent and began setup.Does not show successful completion.
Meaningful action completedA task associated with the feature’s intended outcome was completed.The action still may not produce satisfaction or business impact.
Workflow completedThe user moved through the required start-to-finish sequence.A completed workflow can still be low quality or one-time.
Output saved, shared, exported, or publishedThe feature produced a durable or collaborative output.Automatic outputs and duplicate retries must be excluded.
Repeated use in different sessions or periodsThe behavior extended beyond one visit or trial.The required cadence must fit the feature.

When a page view can be useful

Opening a page can be the right metric when the decision is about discovery, reach, or navigation. It can also be part of a meaningful-use definition for a genuinely read-only feature whose intended value is information consumption.

Even then, distinguish a route load from credible consumption. A rendered view, engaged activity, interaction, or return behavior may provide stronger evidence. Engaged time is still an attention signal, not proof that the user understood or valued the content.

Name the metric “page reach” or “page usage” when that is what it measures.

Define the account threshold as well as the event

For an account-level rate, the event alone is not enough. Specify how user behavior rolls up to an account.

Examples:

  • at least one permitted user publishes a report;
  • at least two distinct users collaborate in the workflow;
  • an administrator configures the feature and another user consumes its output;
  • the account completes the workflow in two distinct weeks.

The correct rule depends on the value model of the feature.

Instrument outcomes, not just clicks

A click on “Export” may fire before the export succeeds. A page can load after an error. Retries can produce duplicate events. Background processes can generate outputs without a user action.

Where possible, track the confirmed state change or successful output. Document deduplication rules and exclude internal, automated, and test activity.

Validate the event with behavioral evidence

A technically valid event can still have the wrong meaning. Review real sessions, support evidence, interviews, or usability research to confirm that the event corresponds to the behavior the team intended to measure.

Adoption data should inform investigation, not replace it.

Choosing the measurement window

The measurement window should include enough natural opportunities to use the feature. The following examples are analytical starting points, not industry benchmarks.

Analytical starting points

Illustrative measurement windows for features with different natural cadences.
Feature cadencePractical window framingPossible repeated-use rule
Daily workflowA complete 7- or 14-day cycle that includes weekdays and relevant weekend behavior.Qualifying use on a declared number of distinct days.
Weekly collaborationFour complete weeks or another window containing several expected collaboration cycles.Qualifying use in at least two or more distinct weeks.
Monthly reportingAt least one complete reporting cycle for current-period reach; multiple cycles for repeated use or retention.Qualifying use in two separate monthly cycles.
Quarterly or low-frequency workflowA full business quarter, a trigger-based opportunity window, or a cohort measured from the relevant business event.Completion in successive eligible cycles rather than arbitrary weekly activity.
Newly released featureCohorts based on first access or exposure, each given the same opportunity window.Return after initial adoption once the novelty and rollout period can be separated.

Period, cumulative, cohort, and retained adoption are not interchangeable

Period adoption asks which eligible active entities used the feature inside a selected calendar window.

Cumulative adoption asks which eligible entities have ever met the threshold by a given date.

Cohort adoption asks which entities adopted within a fixed number of days after becoming eligible or being exposed.

Retained feature usage asks which initial adopters returned in later opportunity periods.

Label the series so a reader can tell which one is shown.

Newly released features need equal opportunity

A customer that received access yesterday should not be judged against one that received access 30 days ago without adjustment.

For a release analysis:

  1. record the first eligibility or exposure date;
  2. give each entity the same adoption opportunity;
  3. separate early-access, staged-rollout, and general-release cohorts when their context differs;
  4. distinguish novelty-driven first use from repeated use; and
  5. show raw adopter and eligible counts alongside the percentage.

Worked B2B example: Reporting adoption

All companies, users, and values in this example are fictional and illustrative. They are not Hymetry customer data, results, or benchmarks.

Assume a B2B SaaS product has a Reporting feature. Reporting is available only on eligible plans after the account connects a required data source.

The team defines a 30-day measurement window:

  • Discovery: an eligible user opens Reporting.
  • Meaningful user adoption: the user completes a report and saves, shares, exports, or publishes its output.
  • Meaningful account adoption: at least one eligible user in the account meets that threshold.
  • Repeated user use: an initial adopter meets the meaningful threshold in at least two distinct weeks.

The database contains eight created accounts. Six were active during the 30-day window. Five of the active accounts were eligible for Reporting.

Illustration only

Illustrative Reporting adoption data for eight fictional B2B accounts.
AccountStatus in windowEligible for Reporting?Active usersUsers who opened ReportingUsers who completed and saved or shared a reportMeaningful account adopter?Interpretation
Atlas WorksActiveYes854YesAdoption extends beyond one person.
Birch HealthActiveYes532YesSeveral users reached meaningful use.
CopperlineActiveYes411YesThe account depends on one champion.
Delta FreightActiveYes620NoUsers discovered Reporting but did not complete the meaningful action.
Ember LabsActiveYes200NoNo discovery during the window.
Foxtrot SystemsActiveNo700ExcludedIts plan or setup does not make it eligible.
Grove StudioInactiveNot evaluated000ExcludedIt had no valid activity in the selected period.
Harbor DeskInactiveNot evaluated000ExcludedIt had no valid activity in the selected period.

Account adoption rate

Three of the five eligible active accounts met the meaningful threshold:

Meaningful account adoption

3 meaningful adopting accounts ÷ 5 eligible active accounts × 100 = 60% meaningful account adoption

This answers:

What share of eligible active customer accounts completed the defined Reporting workflow through at least one user?

It does not say how broadly Reporting spread inside each account.

User adoption rate

The five eligible active accounts contained 25 active users:

  • Atlas Works: 8
  • Birch Health: 5
  • Copperline: 4
  • Delta Freight: 6
  • Ember Labs: 2

Seven users met the meaningful threshold:

Meaningful user adoption

7 meaningful adopting users ÷ 25 eligible active users × 100 = 28% meaningful user adoption

The account rate is 60%, while the user rate is 28%. Both are correct because they answer different questions.

User penetration inside adopting accounts

The meaningful adopting accounts were Atlas Works, Birch Health, and Copperline. Together, they had 17 active users:

Active users inside adopting accounts

8 + 5 + 4 = 17 active users inside meaningful adopting accounts

Seven of those users met the meaningful threshold:

Meaningful user penetration

7 meaningful adopting users ÷ 17 active users inside adopting accounts × 100 = 41.2% user penetration

Copperline illustrates why the distribution matters. It contributes one full account to the 60% account adoption rate, just like Atlas Works, but only one of its four active users adopted. Account adoption alone would hide that dependence on a single champion.

Changing “page opened” to a meaningful action changes the answer

Four eligible active accounts opened Reporting: Atlas Works, Birch Health, Copperline, and Delta Freight.

Discovery versus meaningful account adoption

Account discovery or reach

4 accounts that opened Reporting ÷ 5 eligible active accounts × 100 = 80%

Meaningful account adoption

3 accounts that completed the meaningful threshold ÷ 5 eligible active accounts × 100 = 60%

At user level:

  • 11 of 25 eligible active users opened Reporting: 44% user reach
  • 7 of 25 completed the meaningful action: 28% meaningful user adoption

The 80% and 60% account rates are both mathematically correct. The first answers whether accounts reached the feature. The second answers whether accounts completed the declared value-bearing workflow. Calling both simply “feature adoption” would erase the difference.

Changing the denominator also changes the answer

Keep the meaningful numerator fixed at three accounts:

Illustration only

Illustrative feature adoption rates for three account denominators.
DenominatorCalculationRateQuestion answered
All created accounts3 ÷ 837.5%How much of the entire created account base met the threshold?
All active accounts3 ÷ 650%How much of the currently active account base met it, including an ineligible account?
Eligible active accounts3 ÷ 560%How much of the active population with access and opportunity met it?

None of these calculations contains an arithmetic error. Only the third is the defensible answer to the declared question about current eligible customers.

The same issue appears at user level. There were 32 active users across all six active accounts, but only 25 were inside eligible accounts:

  • 7 ÷ 32 = 21.9% when every active user is included
  • 7 ÷ 25 = 28% among eligible active users

The denominator label is part of the result, not a footnote.

Bar chart showing three meaningful adopter accounts divided by all eight created accounts, six active accounts, and five eligible active accounts, producing 37.5%, 50%, and 60%.
The numerator is unchanged. The rate changes because each denominator answers a different question.

Repeated-use rate

Suppose four of the seven initial meaningful adopters completed the Reporting workflow in at least two distinct weeks.

Repeated-use rate

4 repeated users ÷ 7 initial meaningful adopters × 100 = 57.1% repeated-use rate

That rate concerns repetition among initial adopters. It is not the same as 30-day user adoption, and it is not yet long-term feature retention.

What the example does and does not show

The example produces several valid measurements:

  • 80% eligible-account discovery or reach
  • 60% meaningful account adoption
  • 28% meaningful user adoption
  • 41.2% meaningful user penetration inside adopting accounts
  • 57.1% repeated use among initial meaningful user adopters

Together, they show that Reporting reached most eligible accounts, completed meaningful use in three, spread unevenly among users, and retained some initial adopters within the selected cadence.

They do not establish that users were satisfied, that reports improved business decisions, that the feature caused retention, or that every adopting account received equal value.

What is a good feature adoption rate?

There is no universal good feature adoption rate for B2B SaaS. A percentage is useful only in relation to the feature’s audience, purpose, maturity, cadence, and prior expectations.

Core versus optional features

A core workflow intended for nearly every eligible customer should be evaluated differently from an advanced export, regional report, or specialist integration.

Low global reach can be healthy for an optional feature if the relevant use-case segment adopts and repeats it. High reach can still be weak when a mandatory workflow is opened but rarely completed.

Role-specific capabilities

Administrator-owned workflows naturally have lower user adoption and penetration when calculated across the whole account. Account completion among eligible administrators may be the better measure.

Do not compare an administrator-only billing feature with a general collaboration feature using one undifferentiated user denominator.

Collaborative versus administrator-owned workflows

For an administrator-owned setup feature, one qualified user may be sufficient for account adoption.

For collaboration, account adoption based on one user can be misleading. The threshold may need multiple participants, role coverage, shared output, or sustained use inside the account.

Maturity of the feature

A new feature has had less time to be discovered, understood, and incorporated into established workflows. Compare features at similar maturity or use exposure-based cohorts.

A mature feature should not receive permanent credit from cumulative first use if current-period usage has disappeared.

Account lifecycle

New, onboarding, established, expanding, and reactivated accounts have different opportunities and needs. Compare relevant lifecycle cohorts instead of treating the global rate as a universal norm.

Product cadence

A daily workflow should show a different repeated-use pattern from quarterly reporting. The right question is not “How often should every feature be used?” but “Did eligible entities use it at the cadence required to receive its intended value?”

Quality of the eligible denominator

A high rate produced by a narrow or outcome-dependent denominator is not automatically strong. A low rate calculated against users without access is not automatically weak.

Audit the denominator before interpreting the result.

Relevant peer groups and previous periods

Useful comparisons include:

  • the same feature in the preceding equivalent period;
  • matched release or onboarding cohorts;
  • accounts with similar plans, lifecycle stages, industries, sizes, or prerequisites;
  • comparable features with similar roles and cadence; and
  • a predeclared product target based on expected behavior.

Avoid generic benchmark percentages when the benchmark’s entity, eligibility, event, and window do not match your definition.

Hymetry’s editorial position is that a “good” rate is one that is correctly defined, meets a declared expectation for the relevant cohort, distributes appropriately across accounts and users, and is supported by evidence that the qualifying behavior represents the intended workflow. Adoption alone is not proof of customer value.

How to compare feature adoption over time

Keep the definition stable

Use the same:

  • entity;
  • eligibility rules;
  • behavior threshold;
  • window length;
  • activity definition;
  • identity and deduplication logic; and
  • account or user exclusions.

If the definition must change, version the metric. Backfill the new definition where possible or start a clearly marked new series. Do not splice incompatible definitions into one trend line.

Show raw counts with the rate

A move from 2 of 4 accounts to 3 of 5 accounts differs from a move from 200 of 500 to 300 of 500, even when a percentage comparison appears similar.

Show numerator and denominator near the percentage, especially for small cohorts.

Watch denominator composition

Adoption can change because:

  • more accounts upgraded to an eligible plan;
  • a large customer became active;
  • new onboarding accounts entered the cohort;
  • inactive customers left the denominator;
  • permissions changed; or
  • prerequisite completion improved.

Break the rate into numerator and denominator movement before attributing the change to feature behavior.

Use percentage points for changes between rates

When adoption moves from 40% to 50%, the arithmetic difference is:

Percentage-point change

50% − 40% = 10 percentage points

The relative percentage change is:

Relative percentage change

(50% − 40%) ÷ 40% × 100 = 25% relative increase

Write “up 10 percentage points” when describing the difference between the two rates. Write “up 25%” only when the relative comparison is intended and the baseline is clear.

When the earlier rate is zero, relative percentage change is undefined. Use raw counts and percentage-point movement instead.

Do not sum daily distinct users or companies

Daily distinct counts cannot be added to produce a selected-period distinct total.

If the same company uses Reporting on Monday and Tuesday, summing daily distinct companies counts it twice. The selected-period total must deduplicate the company across the complete period.

Conceptually:

  • incorrect: sum of each day’s COUNT(DISTINCT company_id)
  • correct: one COUNT(DISTINCT company_id) over the complete selected period

Daily sparklines and selected-period totals answer different questions and do not need to add up.

Common feature adoption calculation mistakes

  1. Counting every account in the denominator. Churned, inactive, test, ineligible, and unconfigured accounts can make current adoption appear artificially low.
  2. Treating a page view as value. A page view is often a useful reach signal, but it does not automatically show that the workflow was completed.
  3. Mixing account and user denominators. Counts must use the same entity on both sides of the ratio.
  4. Changing thresholds after seeing the result. Post-hoc definitions encourage cherry-picking and make period comparisons unreliable.
  5. Summing daily unique users or companies. The same entity can appear on several days. Deduplicate over the complete period.
  6. Using too short a period for a low-frequency workflow. A seven-day window can misclassify a healthy monthly or quarterly process as unadopted.
  7. Hiding concentration behind a global rate. A few large accounts or individual champions can dominate user totals while most accounts remain untouched.
  8. Interpreting adoption as satisfaction or business value. Behavioral use does not directly measure sentiment, outcome quality, causal impact, renewal, or expansion intent.
  9. Comparing features with different eligible audiences. A universal collaboration feature and an administrator-only export should not be ranked without their denominator context.
  10. Ignoring event and identity quality. Duplicate events, failed actions, internal users, automated processes, merged accounts, and missing company identity can alter both numerator and denominator.

A practical process for defining a feature-adoption metric

Use this checklist before building the dashboard or writing the query.

  1. State the product decision. Write the decision the metric should support. For example: “Decide whether Reporting needs better discovery or a simpler completion workflow.”
  2. Choose account or user as the entity. Use the unit that matches the decision. Add the complementary metric separately when needed.
  3. Define eligibility. Specify plans, roles, permissions, prerequisite setup, lifecycle stage, activity requirements, exclusions, and minimum opportunity.
  4. Define meaningful behavior. Write the exact event, successful state change, sequence, or account roll-up that qualifies.
  5. Select the time window. Match the feature’s natural cadence and include complete opportunity cycles.
  6. Decide whether first use or repeated use matters. A one-time setup feature and a recurring collaboration feature should not share the same rule.
  7. Inspect distribution across accounts. Look for champion concentration, large-account dominance, role gaps, and differences between customer segments.
  8. Validate the definition with real sessions or user evidence. Confirm that the tracked action represents the intended behavior and investigate exceptions.
  9. Keep the definition stable when comparing periods. Version changes, show raw counts, and avoid rewriting history after results are known.

A complete metric specification should fit in a short record containing:

  • metric name;
  • product decision;
  • entity;
  • numerator;
  • denominator;
  • qualifying event or sequence;
  • account roll-up rule;
  • time window;
  • repeated-use rule;
  • exclusions;
  • identity and deduplication rules;
  • segment breakdowns; and
  • owner and definition version.

How Hymetry approaches feature adoption

Hymetry organizes product behavior around product areas, grouped pages or features, companies, users, and Visits.

In Hymetry Pages, raw paths are normalized and organized into grouped pages and product areas so teams can compare meaningful parts of the product rather than treating every dynamic URL as a separate feature. In the current Pages analytical model, page adoption is the share of active companies that used a grouped page during the selected period.

That company-level rate is accompanied by:

  • the companies that used the grouped page;
  • the users who used it;
  • penetration among active users inside adopting companies;
  • Visits;
  • engaged time;
  • interaction signals;
  • current-period versus previous-period trends; and
  • raw-page action evidence where exact behavior needs inspection.

The Companies view provides the account context behind the rate. A product team can distinguish broad account usage from an account that depends on one champion, then compare relevant plans, lifecycle stages, or other company segments.

Visits provide session-level behavioral evidence when an aggregate signal needs investigation. They can help a team inspect the path behind discovery, completion, repeated attempts, or a change in direction without assuming that an aggregate metric explains the cause.

This does not turn every grouped-page visit into proof of meaningful value. For a Reporting workflow, page adoption is evidence that an account reached or used the grouped page. Interaction, raw-page actions, engaged time, user and company context, and relevant Visits help the team determine whether the behavior progressed toward the workflow it intended to measure.

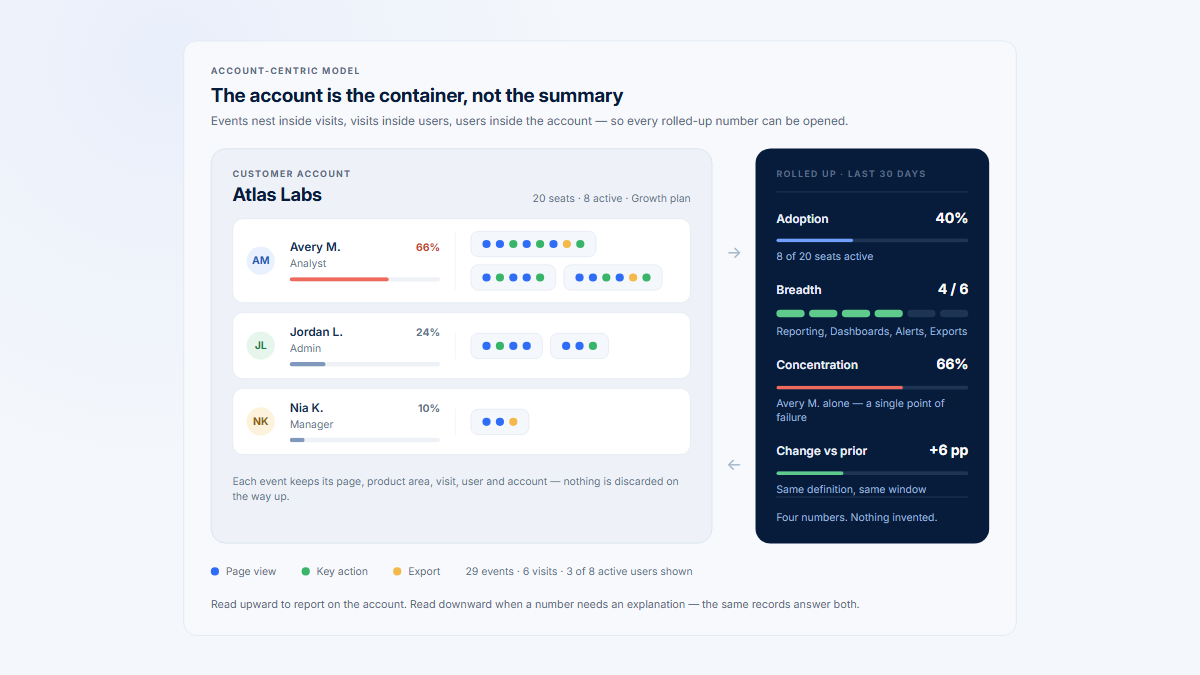
The wider account-centric measurement model is covered in the B2B product analytics guide. The product teams use case shows how page, account, user, and session evidence can support a product decision.

You can inspect the current metrics and structure in the Hymetry demo Pages view.

Frequently asked questions

What is feature adoption rate?

Feature adoption rate is the percentage of eligible active accounts or users that meet a defined behavior threshold for a feature inside a defined time window. The entity, eligibility rule, behavior, and window must be stated with the percentage.

What is the feature adoption rate formula?

The general formula is:

Distinct eligible entities that meet the adoption threshold ÷ distinct eligible entities with an opportunity to adopt × 100

For B2B SaaS, calculate separate account and user rates when both are relevant.

Should B2B SaaS measure account adoption or user adoption?

Use account adoption to measure spread across customer organizations. Use user adoption to measure spread across eligible people. Add penetration to understand how broadly usage spreads inside adopting accounts. The product decision determines which is primary.

Does opening a feature page count as adoption?

It can count when the metric is explicitly about page discovery, reach, or usage. It is not automatically meaningful adoption. When value requires completion, use the successful action or workflow as the threshold and report the page open separately.

What is a good feature adoption rate?

There is no universal percentage. The appropriate expectation depends on whether the feature is core or optional, role-specific or collaborative, new or mature, daily or low-frequency, and whether the denominator contains only eligible entities with a fair opportunity to adopt.

How often should feature adoption be measured?

Use a window that fits the natural workflow. Daily features may need a complete week or two. Weekly collaboration may need several weeks. Monthly or quarterly workflows need complete business cycles. New releases are often clearer when measured from each entity’s first eligibility date.

Can daily unique users or companies be summed for a monthly total?

No. The same user or company can appear on several days. Recalculate the distinct count over the entire selected period.

What is the difference between feature adoption and user penetration?

Account adoption measures the share of eligible accounts that meet the threshold. User penetration measures the share of active, relevant users inside adopting accounts who use the feature. An account can count as adopted while penetration remains low because only one champion uses it.

Sources

Sources reviewed on 3 August 2026. Vendor educational pages are used for definitions or implementation examples, not for unverified benchmark claims.

  1. Google Research, “Measuring the User Experience on a Large Scale: User-Centered Metrics for Web Applications”
  2. Contentsquare, “How to Measure Feature Adoption: A Complete Framework for Product Teams”
  3. Metabase, “Feature Adoption Rate: Definition, Formula & SQL”
  4. Pendo Help Center, “Build a Data Explorer report”
  5. Pendo Help Center, “Measure retention by first use”
  6. Amplitude Docs, “Helpful definitions”
  7. Amplitude Docs, “How time works in a retention analysis”
  8. Eurostat, “Statistical concept: Percentage change and percentage points”
  9. PostgreSQL Documentation, “Aggregate Expressions”
  10. Hymetry, “Pages Analytics”
  11. Hymetry, “Companies: Account Intelligence”
  12. Hymetry, “Session Visits & Replay”
  13. Hymetry, “Product Teams”
  14. Hymetry, “Demo Pages view”

About Hymetry

Hymetry is account-centric product intelligence for B2B SaaS. It helps teams understand how customer companies and the users inside them adopt and use their product.