Summary
Product analytics changes when the buyer is a company and usage is distributed across several people. This guide explains how to connect account, user, product-area, and session data so you can measure adoption without losing the people and evidence behind it.
Suppose 100 people used your Reporting feature this month.
That sounds encouraging. But it does not yet tell you whether Reporting is becoming part of customers’ workflows.
Those 100 users could represent:
- 100 accounts with one user each;
- 10 accounts with 10 users each;
- one large account with 100 users;
- five healthy accounts and one account generating most of the activity;
- 99 occasional users and one administrator doing nearly all meaningful work.
The total is identical. The product and commercial implications are not.
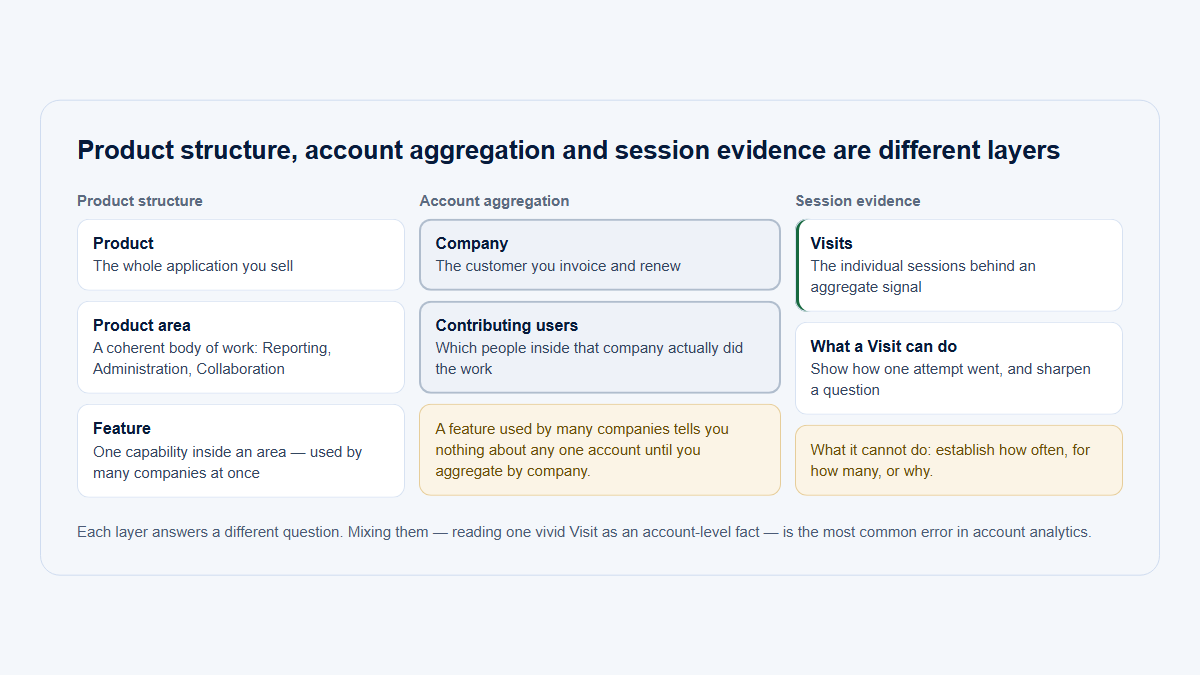
That is the central challenge of B2B product analytics: individual actions matter, but they must be interpreted inside the company, workspace, team, or subscription that the users belong to.
What is B2B product analytics?
In many consumer products, the person using the product is also the customer. In B2B software, those roles are often separated:
- a company buys the product;
- an administrator configures it;
- several teams use it;
- managers evaluate the outcome;
- procurement or leadership decides whether to renew.
Account-level analysis does not replace user analytics. It gives user analytics the correct context.
Product analytics also differs from website analytics. Website analytics is useful for aggregate questions about visitors, acquisition sources, landing pages, and public-site conversions. Product analytics is designed for custom questions about what identified users or groups do inside the product. PostHog’s comparison of web and product analytics describes this distinction.
Three analytics views
| Analytics view | Primary unit | Typical question |
|---|---|---|
| Website analytics | Visitor or session | Which channels bring people to the website? |
| User-level product analytics | Individual user | Which users completed this workflow? |
| Account-centric B2B analytics | Account with contributing users | Which customer accounts adopted the workflow, and how is usage distributed inside each one? |
The three views can coexist. The mistake is expecting a user-only view to answer an account-level question.
Why the account level changes the answer
A global metric can look healthy while hiding a weak customer distribution.
Imagine two products that each have 200 active users.
In the first product, those users are spread across 80 active customer accounts. In the second, 150 of the users belong to one large account and the remaining 50 are spread across five accounts.
The user count is the same. The second product has much higher concentration risk.
The reverse can also happen. An account may appear highly active because one expert user spends hours in the product, while the rest of the customer’s team has never adopted the core workflow.
That account is active, but its adoption may be fragile.
An account-centric model helps answer questions such as:
- Which companies use a feature?
- How many users inside each company use it?
- Is usage broad or dependent on one champion?
- Which product areas have become recurring workflows?
- Which accounts stopped using a previously adopted area?
- Did a release reach more accounts or merely generate more activity inside existing ones?
- Which users and sessions explain the change?
Major product analytics platforms commonly call the underlying capability group analytics or account-level reporting. Mixpanel describes analyzing events by identifiers such as company or account rather than only by individual user, while PostHog supports organization, company, team, or project groups. Segment’s Group specification associates an identified user with a company, organization, account, project, or team. Mixpanel Group Analytics, PostHog Group Analytics, and the Segment Group specification provide implementation examples.
Choose the account entity before choosing the metric
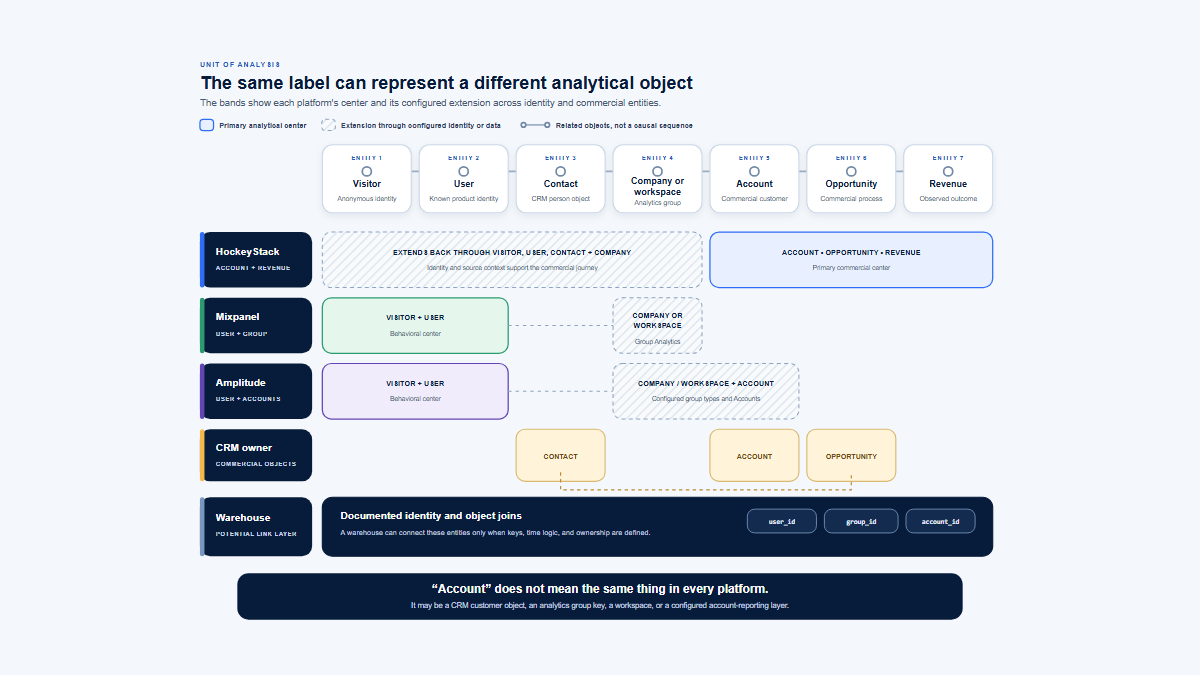
“Account” does not always mean the legal company.
Depending on the product, the useful account entity may be:
- a company;
- an organization;
- a workspace;
- a team;
- a customer tenant;
- a subscription;
- a project;
- a location or franchise;
- a parent company with several child workspaces.
Choose the entity that most closely matches the decision you need to make.
A collaboration product may need both a customer-company ID and a workspace ID. A consulting platform may treat each client project as the operating group while the contracting organization remains the commercial account.
Do not force every B2B product into a single hierarchy.
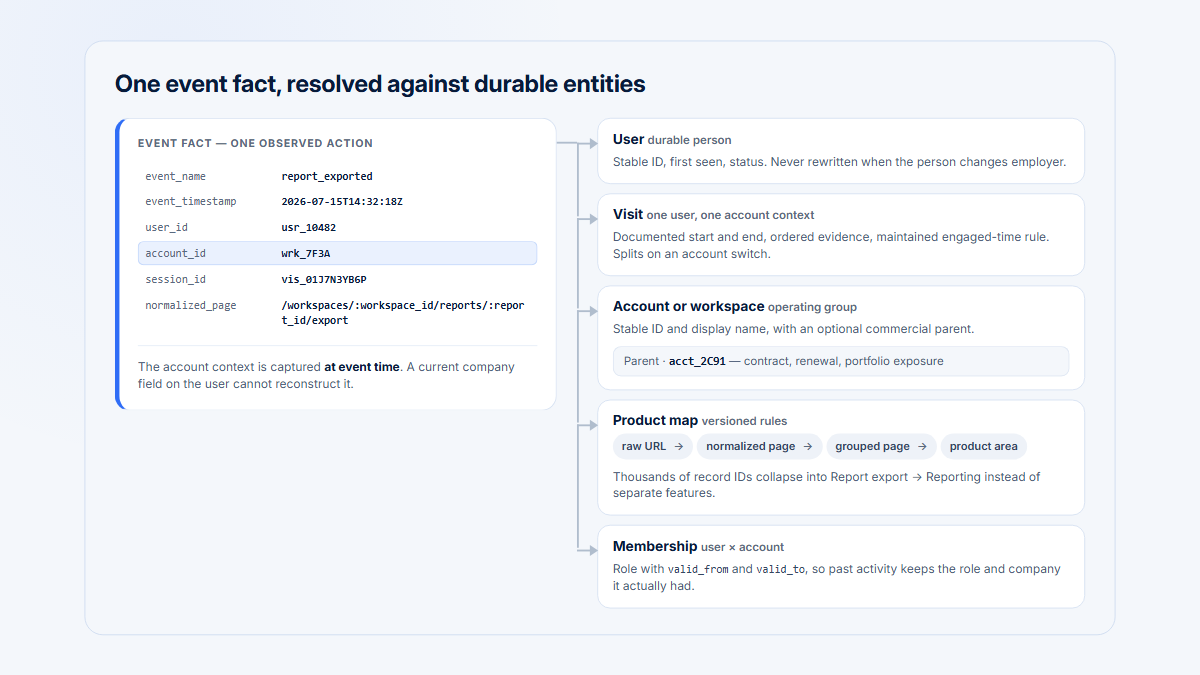
The important requirement is that every event can be connected to the relevant account context at the time it occurred. This is particularly important when one user can switch between several workspaces or customer environments. A static user profile is not enough if the same person performs actions for different accounts.
The five layers of a useful B2B analytics model
A practical account-centric model connects five layers.
1. Account
The account is the customer or operating group whose adoption, engagement, risk, or expansion potential you want to understand.
Useful account attributes may include plan, company size, lifecycle stage, industry, region, onboarding stage, account owner, or renewal period.
2. User
Users explain what is happening inside the account.
They may have different roles and very different influence:
- administrator;
- champion;
- manager;
- contributor;
- occasional viewer;
- new user;
- previously active user who has stopped returning.
A company with ten active users is not necessarily healthier than one with five. The roles, workflows, distribution, and change over time matter.
3. Product area, grouped page, or feature
Raw URLs are often too granular for meaningful adoption analysis.
For example:
/accounts/128/reports/450
/accounts/128/reports/451
/accounts/931/reports/883These paths may all represent the same grouped page or feature:
Report detailsThat grouped page may belong to a broader product area:
ReportingA useful hierarchy is:
Product area → Grouped page or feature → Normalized raw pageUse the product-area and grouped-page levels for adoption, comparison, and trends. Keep normalized raw pages available when you need exact action-level evidence.
4. Visit or session
A visit connects individual actions into a sequence.
It can show:
- where the user entered;
- which pages they opened;
- how long observed activity continued;
- whether they interacted;
- where they changed direction;
- whether they returned to setup;
- where the session ended.
Sessions provide behavioral context, but they should not be the first unit used to judge account health.
5. Event or action
Events are the raw facts:
- page viewed;
- button clicked;
- report exported;
- integration connected;
- invitation sent;
- form submitted.
An event tells you what happened. The other four layers tell you where it happened, who did it, which account it affected, and whether it represents meaningful adoption.
Core B2B product analytics metrics
The purpose of account-level analytics is not to create more metrics. It is to make each metric answer a clearly defined question.
Active accounts
An account is active during a selected period when it produced at least one qualifying product visit or event during that period.
Active accounts
Active accounts = count of distinct account IDs with qualifying activity in the selected period
Define “qualifying activity” explicitly. A background event, automated integration, or internal staff visit may not represent customer activity.
Account adoption rate
Account adoption measures how broadly a capability has spread across relevant customer accounts.
Account adoption rate
Account adoption rate = eligible active accounts that met the adoption threshold ÷ eligible active accounts × 100
The denominator matters.
For a feature available only on an enterprise plan, all customers should not be included. For a workflow intended only for administrators, the adoption threshold should reflect the presence and behavior of eligible administrators.
Always state:
- which accounts are eligible;
- what behavior qualifies as adoption;
- which time window is used.
For a simple page-level metric, one observed visit may be a useful reach or adoption proxy. For a multi-step workflow, a completed meaningful action or repeated use may be a stronger threshold.
User penetration
User penetration shows how broadly a capability is used inside the accounts that adopted it.
User penetration
User penetration = distinct users who used the capability ÷ active users inside the adopting accounts × 100
This is different from dividing by every user in the entire product.
The account adoption rate answers, “How many accounts reached this capability?”
User penetration answers, “How broadly did usage spread inside those accounts?”
Adoption breadth
Adoption breadth describes how much of the relevant product an account uses.
Adoption breadth
Adoption breadth = relevant product areas used by the account ÷ relevant product areas available to the account × 100
A simpler implementation may show the number of adopted product areas rather than a percentage.
Breadth should not reward meaningless navigation. Use product areas that represent actual workflows or value-bearing capabilities.
Usage depth
Depth measures the intensity or quality of usage after adoption.
Possible depth signals include:
- meaningful actions completed;
- active days;
- returning sessions;
- engaged time;
- workflows completed;
- projects created;
- reports shared;
- integrations used.
The right signal depends on what value looks like in the product. Time spent is useful in some tools and misleading in others. A long session may indicate deep work, confusion, or waiting.
Usage concentration
Concentration shows whether account activity is broadly distributed or dependent on a small number of users.
One practical calculation is:
Top-user concentration
Top-user concentration = engaged time or meaningful actions from the account’s top user ÷ total account engaged time or meaningful actions × 100
A high value is not automatically bad. Some products are naturally administered by one specialist.
It is a signal to interpret in context:
- Is the top user an expected administrator?
- Are backup champions active?
- Is a collaborative feature used by only one person?
- Did concentration rise because other users stopped returning?
- Is the account near renewal or still onboarding?
Change over time
Compare current behavior against an equal-length previous period or another meaningful baseline.
Use percentage change for counts and totals:
Percentage change
Percentage change = (current value - previous value) ÷ previous value × 100
Use percentage-point change for rates:
Percentage-point change
Percentage-point change = current rate - previous rate
For example, adoption moving from 40% to 50% is an increase of 10 percentage points, not merely “10%.”
Worked example: one adoption rate, three different account stories
Illustrative account data
Consider a Reporting workflow measured over 30 days.
For this example, an account counts as adopting Reporting after at least one user completes a meaningful Reporting action. The data is illustrative and is not customer data.
| Account | Active users | Reporting users | Account adopted? | User penetration | Top-user share of Reporting activity |
|---|---|---|---|---|---|
| Atlas Labs | 20 | 8 | Yes | 40% | 28% |
| Northstar Works | 10 | 1 | Yes | 10% | 91% |
| Beacon Systems | 12 | 0 | No | 0% | — |
The account adoption rate is:
Account adoption rate in the example
2 adopting accounts ÷ 3 eligible active accounts = 66.7%
User penetration inside the adopting accounts is:
User penetration inside adopting accounts
9 Reporting users ÷ 30 active users in Atlas Labs and Northstar Works = 30%
Overall active-user reach is:
Overall active-user reach
9 Reporting users ÷ 42 active users across all three accounts = 21.4%
All three calculations are valid, but they answer different questions.
Atlas Labs
Reporting has broad internal adoption. Eight people use it, and activity is not dominated by one user.
This looks more likely to be an established team workflow.
Northstar Works
The account qualifies as adopted, but nearly all activity comes from one person.
The aggregate adoption rate hides champion dependency. The next step is not necessarily to promote more features. It may be to understand whether Reporting is intentionally owned by one specialist or whether wider adoption is blocked.
Beacon Systems
The account is active elsewhere in the product but has not adopted Reporting.
This could indicate:
- the workflow is irrelevant to Beacon;
- the account is not eligible;
- users have not discovered it;
- setup is incomplete;
- the current product does not solve their Reporting need.
The metric identifies an adoption gap. It does not identify the cause.
A practical account-level analysis workflow
A useful analysis should lead from a decision to evidence and back to a measurable result. It can help product teams improve workflows and customer success teams focus account conversations on relevant evidence.
1. Start with the decision
Do not begin with “Which dashboard should we build?”
Begin with a decision such as:
- Should we improve Reporting onboarding?
- Did the new workflow spread beyond existing power users?
- Which accounts need help before a renewal conversation?
- Is a drop in engagement broad or limited to one segment?
- Should customer success introduce an underused workflow?
2. Define meaningful behavior
Choose the behavior that represents progress.
For Reporting, it may be:
- creating a report;
- saving a report;
- exporting data;
- sharing a report;
- returning to Reporting in a later session.
Opening the Reporting page may show discovery. It may not show adoption.
3. Define the eligible population
Decide which accounts and users belong in the denominator.
Consider:
- plan access;
- user role;
- onboarding stage;
- product configuration;
- account age;
- industry or use case;
- whether the workflow is optional or essential.
An adoption metric without an eligibility rule can make a healthy niche capability look unsuccessful.
4. Select a window that matches the product cadence
A daily workflow may be understood through a seven- or 30-day window.
A monthly financial close, quarterly planning process, or annual compliance workflow requires a longer period.
There is no universal correct window. Choose one that gives an eligible user a realistic opportunity to perform the behavior.
5. Inspect the account distribution
Do not stop at the global average.
Look at:
- how many accounts adopted;
- which segments adopted;
- adoption breadth;
- change from the previous period;
- accounts above and below a relevant peer baseline;
- accounts where usage is concentrated.
6. Inspect the users inside affected accounts
Once an account stands out, determine:
- who drove the change;
- which roles are active;
- whether usage is broad;
- whether a champion disappeared;
- whether new users are gaining momentum;
- whether the account depends on one person.
7. Open only the relevant visits
Use the account and user signals to select sessions worth reviewing.
Compare, for example:
- users who completed the workflow against users who stopped early;
- deeply adopted accounts against shallow accounts;
- sessions before and after a release;
- a previously active user’s last successful session against their final incomplete session.
Do not browse random recordings and hope to discover a pattern.
8. Take action and remeasure
The action may be:
- changing onboarding;
- fixing a workflow;
- clarifying permissions;
- contacting an account;
- inviting backup champions;
- improving discoverability;
- deciding that the feature is intentionally niche.
Return to the same definition, denominator, and time window after the change.
What should your tracking implementation contain?
You do not need to capture every possible event before account-level analytics becomes useful.
You need a dependable identity and product structure.
A simplified event may look like this:
{
"event": "report_exported",
"occurred_at": "2026-07-29T10:14:22Z",
"user_id": "usr_1842",
"account_id": "acct_0298",
"session_id": "sess_7711",
"page": "Report builder",
"product_area": "Reporting"
}Stable account and user identifiers
Use stable internal IDs.
Names and email addresses may change and should not be the primary join keys.
Account context on the event
When users can belong to several workspaces or accounts, associate the event with the account that was active when the action occurred.
Do not assume one permanent user-to-account relationship if the product does not work that way.
A maintainable product hierarchy
Map dynamic URLs into normalized raw pages, grouped pages or features, and product areas.
Without this structure, the same workflow may appear as hundreds of unrelated paths.
Meaningful events
Use custom events for actions that represent real progress.
Autocaptured clicks and page views can help with discovery and investigation, but they do not automatically define product value.
Visits and timing
Store enough timing and session context to understand sequences, return behavior, and engaged activity.
Be clear about whether a duration represents total elapsed time, observed active time, or another calculation.
Account attributes
Attributes such as plan, size, lifecycle stage, industry, region, and onboarding status make account comparisons more useful.
Keep these attributes separate from behavioral events while ensuring they can be applied consistently across analysis.
Privacy controls
Capture only the information needed for the intended analysis.
Use masking, exclusions, ignored elements, URL rules, and capture-scope controls before sensitive information enters analytics or session recordings.
Anonymous activity can still support aggregate page analysis, but account and user metrics require stable identification.
Common B2B product analytics mistakes
Common mistakes and better approaches
| Mistake | What it distorts | Better approach |
|---|---|---|
| Treating every user as an independent customer | Hides the commercial account and internal usage distribution | Connect users and events to the relevant account |
| Including every created account in every denominator | Makes optional or unavailable features look under-adopted | Define eligible and active accounts explicitly |
| Treating logins or page views as proof of value | Confuses access or discovery with meaningful adoption | Define a behavior that represents progress |
| Looking only at global averages | Hides account segments, concentration, and outliers | Inspect distributions and affected accounts |
| Summing daily unique counts | Counts the same account or user repeatedly | Count distinct identifiers across the full period |
| Combining every signal into one unexplained score | Makes movement difficult to interpret | Keep adoption, breadth, depth, recency, and concentration inspectable |
| Treating usage decline as proof of churn | Ignores budget, leadership, procurement, seasonality, and offline context | Use product behavior as an investigation signal |
| Watching random session replays | Consumes time without a clear question | Select sessions from an account, user, or workflow signal |
A good metric reduces uncertainty. It does not pretend to know more than the underlying evidence supports.
From account signal to source evidence
Account-level analytics tells you where attention may be needed.
It does not automatically explain intent.
A complete investigation may use several types of evidence:
- product metrics identify the pattern;
- account data identifies the affected customer;
- user data shows who contributed to the result;
- visits show the sequence of behavior;
- session replay provides visual context;
- customer conversations explain needs and intent;
- commercial data adds contract and lifecycle context.
No single source is sufficient for every decision.
A drop in Reporting activity may mean users are blocked. It may also mean the team completed its monthly reporting cycle, switched responsibilities, changed its process, or no longer needs the workflow.
The correct sequence is:
This keeps product analytics useful without turning every fluctuation into an alert.
How Hymetry approaches B2B product analytics
Hymetry connects four product views so teams can move from an account-level signal to the evidence behind it. This account-first analysis path reflects Hymetry’s vision for product intelligence.
Pages
Pages organizes raw product paths into product areas and grouped pages or features. It shows where adoption happens, how broadly workflows spread across companies, and which page-level signals deserve investigation.
Companies
Companies brings product usage together at the account level. It helps teams review adoption breadth, active users, engagement, concentration, change, risk signals, and possible expansion gaps.
Users
Users shows the people behind each account result: active users, champions, light users, passive users, users losing momentum, and users who may need attention.
Visits
Visits provides session-level context when an account, page, or user signal needs evidence. It keeps the detailed sequence separate from the account overview until the investigation requires it.
This creates a practical analysis path:
Account signal → Product area → Contributing users → Relevant visitsThe objective is not to replace product judgment with a score. It is to make the evidence behind a decision easier to find.
Frequently asked questions
What is the difference between B2B product analytics and ordinary product analytics?
Ordinary product analytics often begins with individual users, events, funnels, and retention. B2B product analytics adds the customer account as a first-class entity and examines how several users collectively create adoption, engagement, risk, or expansion signals inside that account.
Should the account or the user be the primary analytics unit?
Use the account as the primary unit for commercial and customer-level questions. Use the user as the primary unit when you need to understand roles, behavior, friction, or who contributed to the account result.
In practice, useful B2B analytics requires both.
Should I use company, account, workspace, or team as the group?
Use the entity that matches the decision.
If the whole company renews together, company may be correct. If each workspace can buy, configure, and churn independently, workspace may be more useful. Products with complex tenancy may need both a commercial account and an operating group.
What counts as feature adoption in B2B SaaS?
Feature adoption requires a predefined qualifying behavior, an eligible population, and a time window.
For a simple page, one visit may be a useful reach proxy. For a workflow, adoption may require completing a meaningful action, returning later, or reaching a minimum level of use.
Do not define adoption only after seeing which threshold produces the most attractive result.
Can product usage predict customer churn?
Product usage can reveal changes worth investigating, including declining activity, narrower adoption, lost champions, or repeated friction.
It cannot independently prove that an account will churn. Renewal decisions can also depend on budget, leadership, procurement, product fit, implementation, support, and circumstances not visible in behavioral data.
Treat usage as evidence for prioritization, not a deterministic verdict.
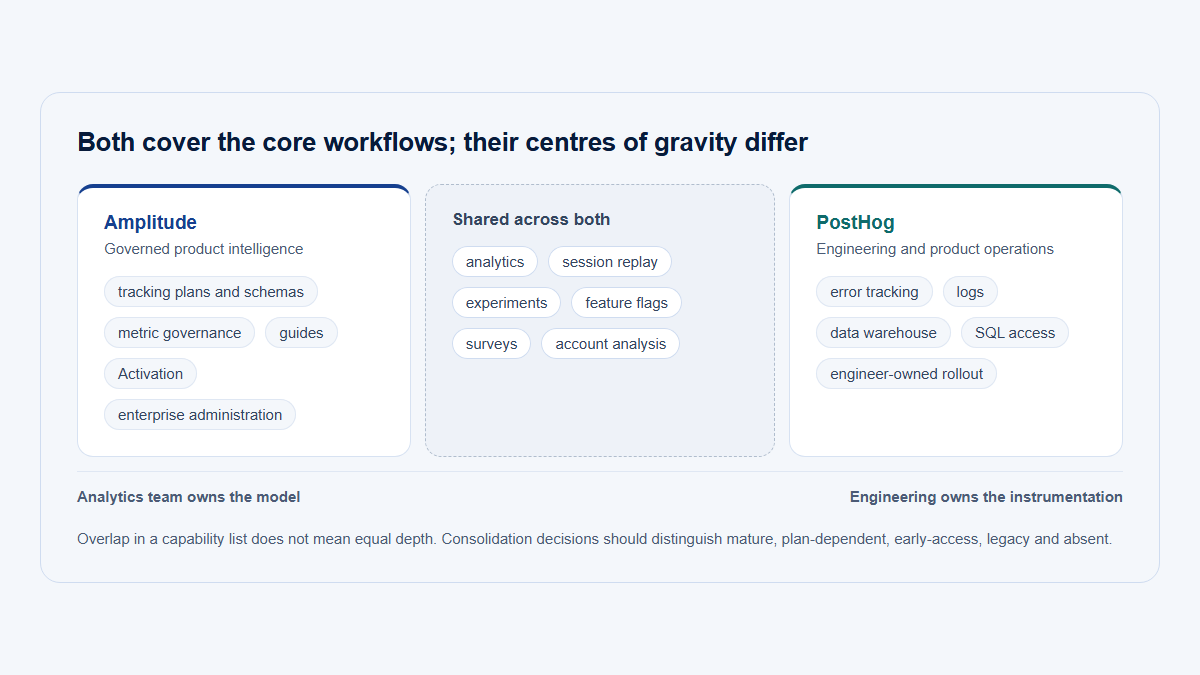
Is session replay part of product analytics?
Session replay is behavioral evidence that complements product analytics.
Analytics helps identify which accounts, users, product areas, and changes deserve attention. Replay helps inspect what happened in selected sessions. Starting with the signal is normally more efficient than browsing recordings without a question.
Sources
- PostHog, “What is the difference between web analytics and product analytics?”
- Mixpanel, “Group Analytics: Group users together as an aggregated unit of measurement”
- PostHog, “Group analytics”
- Twilio Segment, “Spec: Group”
- Hymetry, “Account-Centric Product Intelligence for B2B SaaS”
- Hymetry, “Pages Analytics”
- Hymetry, “Companies: Account Intelligence”
- Hymetry, “User Intelligence for B2B SaaS”
- Hymetry, “Visits”