Menu
B2B product analytics

How to Measure Product Usage by Company in B2B SaaS

A practical guide to the identity model, event context, product hierarchy, account metrics, and company overview needed to measure B2B SaaS usage reliably.

Why company-level usage matters in B2B SaaS

Most B2B products are bought, renewed, and managed at a level above the individual user. The contracting customer may be a company, but the product may be operated through workspaces, teams, locations, or projects. Several people collectively produce the customer’s result.

That changes the questions a product team needs to answer.

A user total can show that 120 people were active. It cannot show whether those people were spread across 30 healthy customer accounts or concentrated in one large customer. A feature can have thousands of uses while remaining absent from most accounts. An apparently active company can depend almost entirely on one champion. Another company can return every week but never adopt the workflow it bought the product to use.

Company-level measurement matters because:

  • the company, account, or workspace normally buys and renews;
  • several users collectively create the customer result;
  • usage can be broad across a team or dependent on one champion;
  • one large customer can dominate global activity;
  • plan, size, lifecycle stage, and expected use case affect which comparisons are relevant;
  • product and customer-success decisions often require an account distribution, not just a user total.

This is one reason B2B product analytics needs both account-level and user-level views. The account is the commercial or operating context. Users explain how participation is distributed inside it.

What should count as the company?

“Company” is convenient language, but it may not be the correct analytical unit for every product. Depending on the product and business model, the useful account entity may be a:

  • company;
  • account;
  • organization;
  • workspace;
  • tenant;
  • team;
  • subscription;
  • project;
  • location.

The best primary entity is usually the stable group that answers the operational question: within which shared product environment did this activity occur?

Use four questions to choose it:

  1. What unit contains shared data, permissions, configuration, and workflows?
  2. What unit can a user actively switch between inside the product?
  3. At what level are features enabled, restricted, or administered?
  4. At what level should a product manager or customer-success manager take action?

The billing entity is important, but it is not always the best event-level entity.

Consider a fictional customer, Acme Industries. Acme signs one commercial agreement, but its North America and Europe divisions use separate workspaces with different administrators, users, data, and onboarding dates. The useful model may contain both:

  • commercial_account_id = acct_acme_001
  • workspace_id = wrk_acme_eu_014

Events should be attributed first to the active workspace because that is where the behavior occurred. Reporting can then roll several workspaces up to the commercial account when the business question concerns renewal, contract value, or the total customer relationship.

Do not force two genuinely separate operating environments into one behavioral account merely because they share a contract. Conversely, do not treat every project as a separate customer when projects are simply objects inside one workspace.

A practical rule is:

Use the operating group as the primary event context and preserve a separate parent relationship when commercial reporting requires a higher-level rollup.

The minimum B2B analytics data model

Reliable company analytics usually needs more than events and a user profile. At minimum, model these connected records.

RecordGrainEssential fields
EventOne observed product actionEvent ID, event name, timestamp, user ID, active account or workspace ID, visit ID, page or feature context, event properties
Visit or sessionOne contiguous period of use by one user in one account contextVisit ID, user ID, account ID, start and end times, ordered events or page visits
UserOne durable person identityStable user ID, display attributes, first seen, current status
Account or workspaceOne durable operating groupStable account ID, display name, parent account where relevant
User-account membershipOne relationship between a user and an accountUser ID, account ID, role, valid-from time, valid-to time
Product mapOne mapping from raw activity to product structureRaw URL or event, normalized page, grouped page or feature, product area, rule version
Account attributesOne current or effective-dated account profilePlan, size, lifecycle stage, onboarding status, industry, region, expected use case

The user-account membership is important because B2B identity is commonly many-to-many. One person may belong to several workspaces. One workspace normally contains several users.

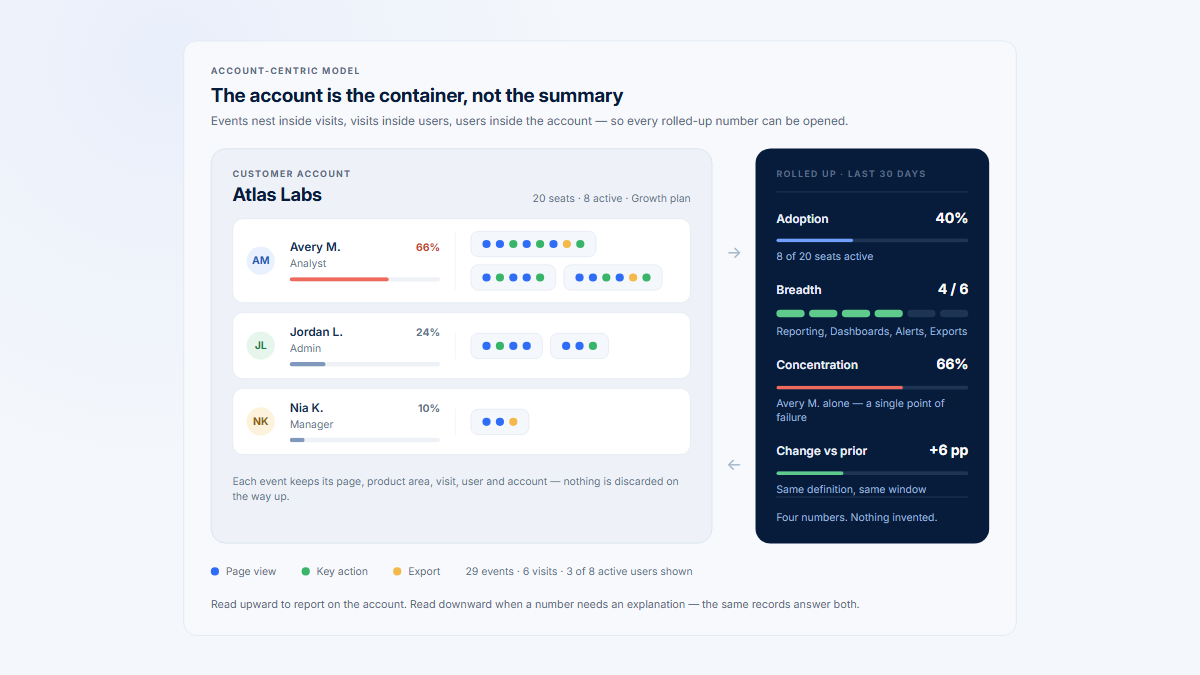
Account-centric analytics model connecting event facts and visits to a user, the active workspace, grouped page, product area, and optional parent commercial account.
A reliable account model preserves the workspace active at event time while keeping the contributing user, visit, page, and product area available for investigation.

Example event

The following fictional event contains enough context to support account-, user-, page-, feature-, and visit-level analysis:

{
  "event_id": "evt_01J7N4Q8K2",
  "event_name": "report_exported",
  "event_timestamp": "2026-07-15T14:32:18Z",
  "user_id": "usr_10482",
  "anonymous_id": "anon_7b3d91",
  "account_id": "wrk_7F3A",
  "commercial_account_id": "acct_2C91",
  "session_id": "vis_01J7N3YB6P",
  "raw_url": "/workspaces/7f3a/reports/983/export",
  "normalized_page": "/workspaces/:workspace_id/reports/:report_id/export",
  "grouped_page": "Report export",
  "product_area": "Reporting",
  "properties": {
    "format": "csv",
    "user_role": "analyst"
  },
  "account_context": {
    "plan": "growth",
    "lifecycle_stage": "active"
  }
}

Not every mutable account attribute has to be copied onto every event. In many systems, the event stores stable identity and behavioral context while plan, industry, size, and lifecycle attributes live in an effective-dated account dimension.

The non-negotiable field is the account or workspace context active when the event occurred.

Preserve event-time account context

Suppose usr_10482 belongs to two workspaces:

  • wrk_7F3A
  • wrk_B81C

If the user exports a report while working in wrk_7F3A, that event belongs to wrk_7F3A even if the user switches to wrk_B81C five minutes later.

A later query must not join all of the user’s historical activity to whichever workspace is currently stored on the user profile. That would rewrite history and move events between customers whenever a membership changes.

Instead:

  • include the active account or workspace ID on the event;
  • maintain the many-to-many membership separately;
  • preserve membership validity periods where they matter;
  • split or reassign the visit when the active account context changes;
  • use a parent commercial account only as an additional rollup.

Official group-analytics specifications use the same basic pattern: identify a stable group key and associate behavior with that group rather than trying to infer the group later from mutable user data.

Identity requirements and multi-account users

Identity problems become account-metric problems. A small error in user or account attribution can change active-company counts, adoption rates, concentration, and historical trends.

Use stable internal IDs

A user ID and account ID should be durable internal identifiers, such as database-generated UUIDs or similarly stable keys.

Names and email addresses are poor primary keys because they can:

  • change;
  • differ in capitalization or formatting;
  • be reassigned;
  • contain aliases;
  • expose more personal information than the analytics model needs;
  • represent a person without identifying the workspace in which an action occurred.

Keep a name or email as a display or contact attribute where necessary. Do not make it the identity foundation when a stable internal ID exists.

The same rule applies to accounts. A customer rename should update the display name, not create a new historical customer or change the primary key.

Handle anonymous activity deliberately

Before login or identification, the tracker may know only an anonymous browser or device ID. When the user authenticates:

  1. retain the anonymous ID on the pre-identification events;
  2. call the product’s supported identify or alias mechanism;
  3. associate the anonymous history only when the match is sufficiently reliable;
  4. reset or rotate anonymous identity on logout or shared-device boundaries where appropriate;
  5. avoid merging activity when the identity is ambiguous.

Anonymous activity may remain useful for page-level or onboarding analysis, but it cannot support reliable account intelligence until an account context is known.

Model user-to-account relationships explicitly

A user profile with one company_id field is insufficient when users can:

  • consult for several customers;
  • administer several workspaces;
  • move between internal business units;
  • belong to a parent organization and a child workspace;
  • leave one employer and join another.

Use a relationship such as:

user_id     account_id    role       valid_from              valid_to
usr_10482   wrk_7F3A      analyst    2026-01-10T09:00:00Z    null
usr_10482   wrk_B81C      admin      2026-04-03T11:30:00Z    null

The event still carries the active account_id. The relationship table explains which memberships were valid and which role the user held.

Plan for renames, merges, and splits

Account lifecycle operations should not silently destroy analytical history.

For a rename:

  • keep the stable account ID;
  • update the display name;
  • preserve the previous name if auditability or search requires it.

For a merge:

  • retain the original account IDs;
  • create a documented parent, alias, or rollup mapping;
  • decide whether reports should show historical behavior separately or combined;
  • do not rewrite raw events without an explicit migration policy.

For a split:

  • define an effective date;
  • assign future activity to the new operating accounts;
  • preserve the original historical attribution unless there is defensible evidence for reclassification.

Separate staff, demo, staging, and test traffic

Internal activity can distort the same metrics intended to represent customers. A product team testing a release may become the most active “account” in the dataset.

Use explicit fields and rules such as:

  • environment = production | staging | development
  • is_internal_user
  • is_demo_account
  • is_test_account
  • known test domains or account IDs
  • impersonation or support-session flags

Apply exclusions consistently across events, visits, users, and companies. Whenever possible, prevent unnecessary invalid or sensitive data from being collected rather than relying only on dashboard filters.

Do not rewrite history when a user changes companies

A person may leave one company and later appear at another. Their old events should remain attributed to the old account.

Depending on the product’s identity and privacy model, the person may retain one stable person ID with effective-dated memberships, or receive a new product identity in the new environment. In either case, historical account attribution must not be replaced with the user’s latest company.

Organizing raw pages, grouped features, and product areas

Account totals become useful only when raw activity is organized into product concepts that people recognize.

A practical hierarchy is:

Raw URL or raw event
→ normalized page
→ grouped page or feature
→ product area

Consider these URLs:

/workspaces/7f3a/projects/128/tasks/993
/workspaces/7f3a/projects/128/tasks/1042
/workspaces/b81c/projects/77/tasks/15

They represent different records, but the same type of product experience.

Normalize them as:

/workspaces/:workspace_id/projects/:project_id/tasks/:task_id

Then map that normalized route to:

Grouped page: Task details
Product area: Project management

Without normalization, each record-specific URL appears to have low adoption and the product hierarchy becomes thousands of arbitrary paths. With normalization, the team can ask useful questions:

  • Which companies use Task details?
  • How many users inside each adopting company use it?
  • Which accounts use Project management but not Reporting?
  • Which visits explain a drop in task activity?

A grouped page does not have to equal one URL. Several routes may form one workflow, and one meaningful feature may also require an explicit action event.

For example:

  • visiting the Reports page shows discovery;
  • changing report filters shows interaction;
  • report_saved shows creation;
  • report_exported shows one possible outcome;
  • report_schedule_created shows adoption of an automated workflow.

Do not label every click as feature adoption. Define the smallest event that represents the behavior the team actually wants to measure.

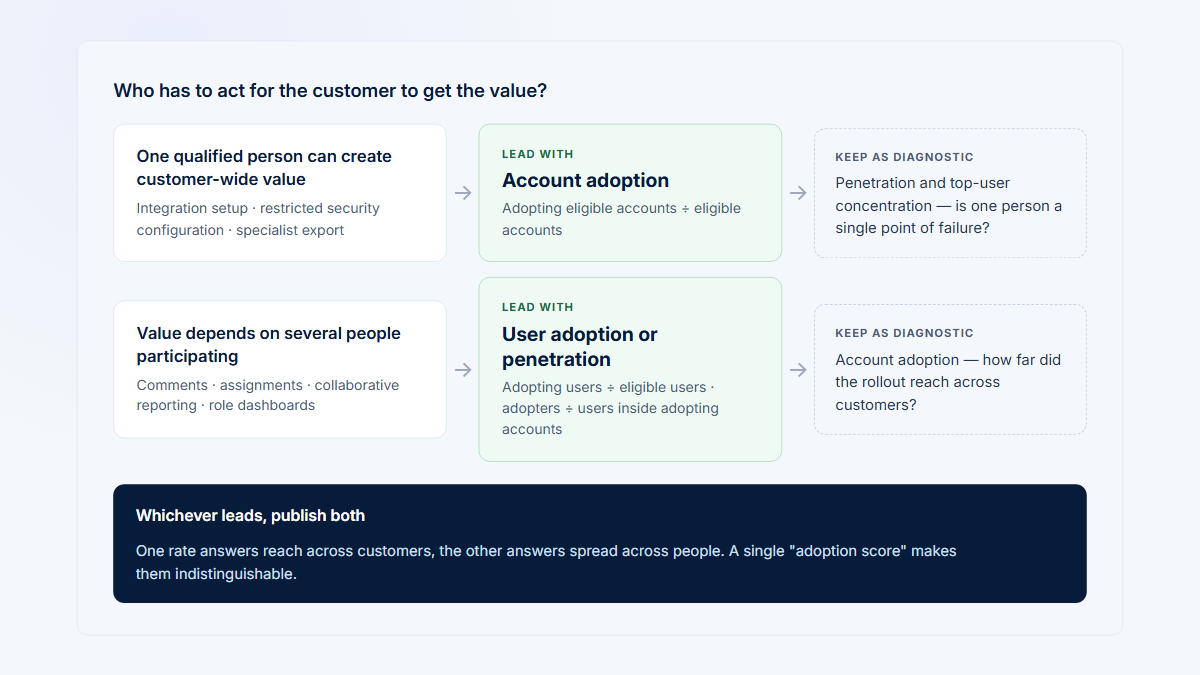
For a deeper treatment of account and user denominators, link to account versus user adoption. Keep detailed feature-adoption threshold design in the dedicated feature adoption rate guide rather than overloading the company model.

The role of visits and sessions

Events are raw facts. A visit or session supplies sequence and context.

An event can tell you:

  • a report was exported;
  • a task was edited;
  • an integration was connected;
  • a settings page was opened.

A visit can tell you:

  • what the user did before and after the event;
  • which pages formed the workflow;
  • whether several actions occurred in one focused use period;
  • whether the user switched accounts;
  • how long the observed interaction lasted;
  • which session is worth investigating.

A session is normally an ordered set of events for one user during one use period. The exact boundary may be defined by:

  • an explicit session ID from the product;
  • an inactivity timeout;
  • an authentication boundary;
  • a selected account or workspace;
  • a workflow-specific start or end event.

There is no universal timeout that fits every B2B product. A support console used continuously throughout the day differs from a monthly reporting workflow. Document the rule and keep it stable enough for comparison.

When a user switches from one workspace to another, start a new visit or at least split the account-level attribution. One session should not accidentally combine activity from two customers into one account record.

A practical implementation workflow

1. Define the company or operating-group entity

Write down the primary analytical unit and why it exists. Decide whether it is the company, account, workspace, tenant, team, subscription, project, or location.

Document any parent-child relationship between an operating workspace and a commercial customer. Include examples that show where events should be attributed and where rollups are appropriate.

2. Establish stable user and account IDs

Use internal identifiers that do not change when a name, email, plan, owner, or branding changes.

Define:

  • user ID generation;
  • account ID generation;
  • anonymous identity handling;
  • user-account membership;
  • account merge and split policies;
  • logout and shared-device behavior.

Test the identity rules before using the data for account comparisons.

3. Attach account context to events

Send the account or workspace active at the time of each action. Do not derive historical account attribution solely from the user’s latest profile.

Include a session or visit ID and an event timestamp. Add an optional commercial parent ID when a higher-level rollup is required.

4. Normalize product pages and features

Remove dynamic identifiers and irrelevant URL variation. Group routes and events into stable product concepts that match how the team discusses the product.

Maintain a reviewable mapping:

raw URL → normalized page → grouped page or feature → product area

Version or audit major rule changes so a redesign does not create an unexplained historical discontinuity.

5. Define meaningful events

Create a controlled event taxonomy for actions that matter to the product.

Prefer names such as:

  • project_created
  • report_saved
  • report_exported
  • integration_connected
  • invite_accepted

over a large collection of ambiguous click events.

Document the event’s actor, account context, triggering condition, expected properties, and duplicate-handling behavior.

6. Build visits or sessions

Group ordered events into visits using an explicit session ID or a documented boundary rule.

Ensure one visit has:

  • one user;
  • one active account context;
  • a start and end;
  • ordered events or page visits;
  • a defensible engaged-time calculation.

7. Aggregate at account, user, feature, and period levels

Build aggregates that preserve multiple grains rather than collapsing everything into one account total.

Useful tables include:

  • account by day;
  • account by complete reporting period;
  • account-user by period;
  • account-feature by period;
  • account-product-area by period;
  • visit summaries.

Complete-period distinct counts must be calculated from the underlying identities, not by summing daily unique counts.

8. Add useful account attributes

Join account context such as:

  • plan;
  • company size;
  • lifecycle stage;
  • onboarding status;
  • industry;
  • region;
  • account age;
  • expected use case.

Keep mutable attributes separate from immutable event facts where appropriate. Use effective dates or snapshots when historical peer comparisons need the attribute value that was valid at the time.

9. Validate against raw evidence

For a sample of companies, trace each summary back to:

  • raw events;
  • normalized pages;
  • user membership;
  • visit sequence;
  • relevant recordings or source views where available.

Ask whether the summary matches what actually happened. Investigate unexpected nulls, duplicated sessions, unusual concentration, and product-area gaps before trusting the dashboard.

10. Exclude staff and invalid traffic

Apply production-environment, staff, demo, staging, automated, support-impersonation, and test-account rules.

Make exclusions visible and testable. Track how much activity is being removed so an overly broad filter does not hide real customers.

11. Monitor identity and grouping quality

Create quality checks for:

  • events without a user ID after authentication;
  • events without account context;
  • users assigned to impossible accounts;
  • account switches inside one unsplit visit;
  • unknown or unmapped pages;
  • sudden growth in raw URL cardinality;
  • duplicate event IDs;
  • late events;
  • renamed, merged, or split accounts;
  • internal traffic leaking into production analysis.

Company analytics is a maintained data product, not a one-time instrumentation project.

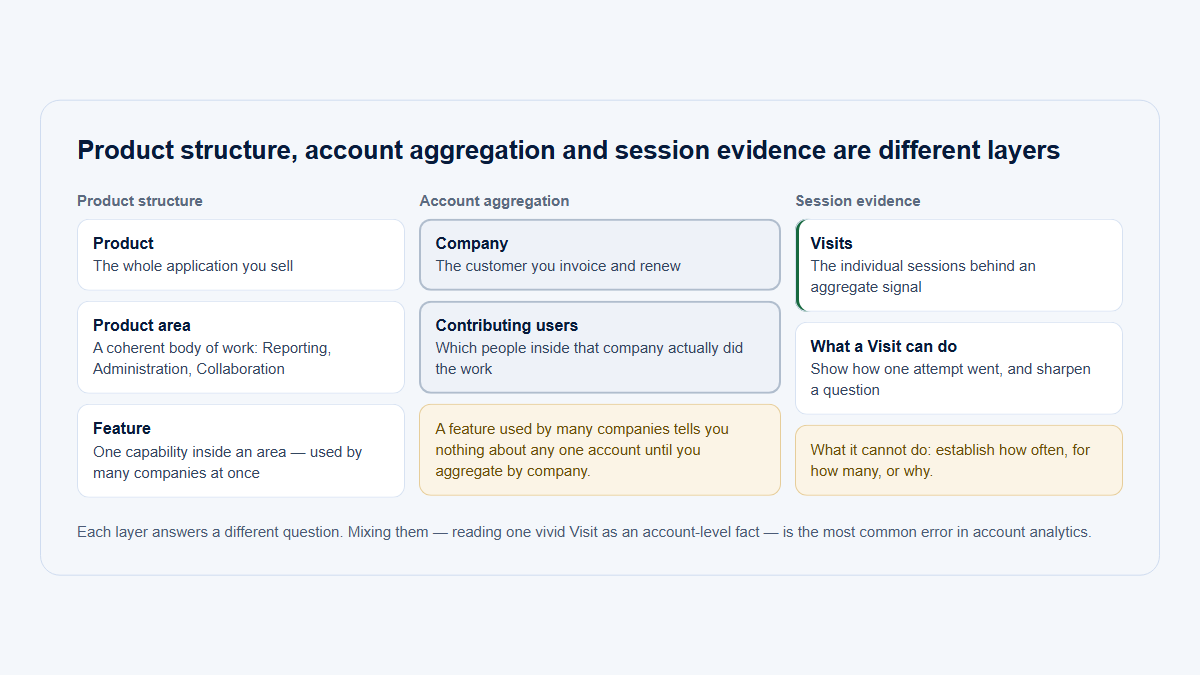
Processing flow from raw product events through identity, page normalization, visits, period aggregation, and a company usage overview.
Company reporting is a processing pipeline, not a single group-by query. Identity, product structure, session context, exclusions, and period logic all affect the result.

Core company-level product usage metrics

A company overview should combine scale, breadth, participation, consistency, change, and evidence. No single metric captures all of them.

Before calculating anything, define:

  • what counts as a valid product visit;
  • which accounts are eligible;
  • which users are eligible;
  • which events are meaningful;
  • which features or product areas are relevant to the account;
  • which timezone defines an active day;
  • which traffic is excluded.
MetricPractical definitionFormula or calculation
Active companiesCompanies with at least one valid product visit in the selected periodCOUNT(DISTINCT account_id)
Active users per companyDistinct users with at least one valid visit in the company during the periodCOUNT(DISTINCT user_id) grouped by account
Visits or sessionsDistinct use periods attributed to the companyCOUNT(DISTINCT session_id)
Engaged timeObserved active product time derived from captured behaviorSum the implementation’s valid active intervals; document idle handling and caps
Meaningful actionsVetted product events that represent relevant behaviorCount events included in the documented meaningful-event taxonomy
Product-area adoption breadthNumber of relevant product areas used by the companyCOUNT(DISTINCT adopted_product_area_id); optionally divide by eligible areas
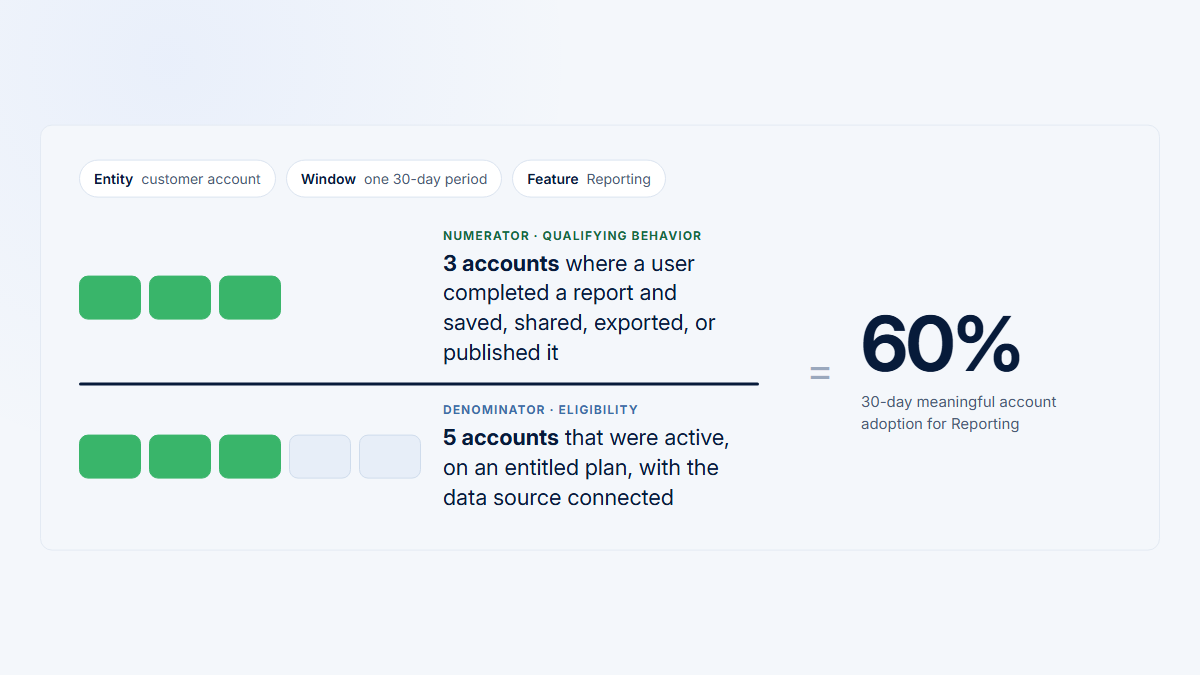
Feature adoptionWhether a company met the qualifying-use definition for a grouped featurePortfolio rate: adopting eligible companies ÷ eligible active companies
User penetrationHow broadly a feature is used inside an accountUsers using the feature ÷ eligible active users in that account
Active daysDistinct dates with valid company activityCOUNT(DISTINCT activity_date)
ConsistencyActivity relative to possible or expected daysActive days ÷ days in period, or a workflow-specific expected-opportunity denominator
RecencyTime since the latest valid company activityPeriod end or current time minus the latest valid visit or meaningful action
Period changeDifference from an equal-length comparable prior periodAbsolute change or (current - previous) ÷ previous; handle a zero baseline explicitly
Top-user concentrationShare of an account metric produced by its leading userLargest user action, visit, or engaged-time total ÷ account total
Newly adopted product areasAreas observed now but not in the previous periodcurrent_area_set − previous_area_set
Dropped product areasAreas observed previously but not in the current periodprevious_area_set − current_area_set

The basis of a concentration metric must be visible. A top user can account for 70% of meaningful actions but only 35% of engaged time. Those are different signals.

Likewise, “dropped product area” should mean “observed in the previous comparison window but not observed in the current one.” It does not prove permanent abandonment.

Total time spent is not automatically value

More time can represent:

  • deep, valuable work;
  • a complex workflow that naturally takes time;
  • waiting;
  • confusion;
  • repeated correction;
  • slow system performance;
  • a user leaving the product open.

Use engaged time as context alongside outcomes, breadth, meaningful actions, consistency, and session evidence. Do not turn a high duration into an automatic positive signal or a low duration into an automatic problem.

Worked example: identical totals, different account reality

The following data is fictional. Imagine a B2B product with four product areas:

  1. Core workspace
  2. Projects
  3. Reporting
  4. Integrations

Two portfolios produce exactly the same 30-day global totals:

Global metricPortfolio APortfolio B
Active companies44
Active users4040
Visits400400
Meaningful actions1,2001,200
Engaged time60 hours60 hours
Product areas observed globally44

A global dashboard would make the portfolios look equivalent.

Portfolio A: usage is broadly distributed

CompanyActive usersVisitsMeaningful actionsEngaged timeActive daysAreas usedTop-user concentration
Oakstone1010030015 h26Core, Projects, Reporting, Integrations22%
Blue Harbor1010030015 h24Core, Projects, Reporting, Integrations24%
Cedarline1010030015 h23Core, Projects, Reporting25%
Northstar1010030015 h25Core, Projects, Integrations23%

Portfolio A has four similarly active companies. Every company has ten active users, at least three adopted product areas, more than twenty active days, and no single user producing more than one quarter of meaningful actions.

The account view still reveals useful gaps. Cedarline has not adopted Integrations, and Northstar has not adopted Reporting. But the overall activity is not dependent on one company or one person.

Portfolio B: one company hides the rest

CompanyActive usersVisitsMeaningful actionsEngaged timeActive daysAreas usedTop-user concentration
TitanWorks2831093045 h30Core, Projects, Reporting, Integrations18%
BrightPath7551659 h12Core, Projects, Reporting52%
Pine Labs430905 h7Core, Projects74%
DeltaOps15151 h3Core100%

TitanWorks produces:

  • 77.5% of all visits;
  • 77.5% of all meaningful actions;
  • 75% of all engaged time.

The global totals mostly describe TitanWorks, not the portfolio.

Pine Labs appears active—it has four users, thirty visits, and ninety meaningful actions—but one person produces approximately 74% of those actions. The account may have a strong champion without broad team adoption.

DeltaOps is also technically active. However, its expected use case is fictional metadata value monthly_reporting, and it has not used the Reporting product area at all. A simple “active company” label would conceal the most important product gap.

The company-level interpretation is therefore different:

  • Portfolio A has broad, comparatively balanced adoption.
  • Portfolio B has the same global volume but substantial customer concentration.
  • TitanWorks can make global feature usage look healthy even when smaller accounts have not adopted it.
  • Pine Labs needs user-distribution context, not just an activity total.
  • DeltaOps needs an expected-use-case comparison, not a generic active or inactive label.
  • Product decisions should examine the distribution of account outcomes rather than treating the portfolio total as one customer.
Illustrative Pine Labs account summary showing four active users, seven active days, two adopted product areas, and seventy-four percent top-user concentration.
The same account can look active in aggregate while remaining narrow, inconsistent, or dependent on one user.

What to show in a company usage overview

A useful company overview should answer three questions:

  1. What is happening?
  2. Who and which product areas produced it?
  3. What evidence should a person inspect next?

It does not need to reduce everything to one composite score.

1. Current usage summary

Show a compact set of clearly defined values:

  • active users;
  • visits;
  • engaged time;
  • meaningful actions;
  • active days;
  • last seen;
  • product areas used.

Include the selected period and the exclusion rules behind the metrics.

2. Trend against a comparable period

Show current and previous values using equal-length windows whenever possible.

Distinguish:

  • absolute change;
  • percentage change;
  • percentage-point change;
  • newly observed behavior;
  • a metric whose previous value was zero.

A current rate of 45% compared with 35% is an increase of 10 percentage points, not 10%.

3. Product-area adoption

Show which relevant product areas are:

  • adopted;
  • newly adopted;
  • no longer observed;
  • not yet adopted;
  • not applicable because of plan, entitlement, or expected use case.

An account using four of four relevant areas is different from an account using four of eight. Keep the denominator visible.

4. Active users and their distribution

Show the people behind the company total:

  • consistently active users;
  • light or occasional users;
  • users gaining momentum;
  • users losing momentum;
  • previously active users who have dropped;
  • new participants.

Avoid interpreting a behavioral label as a psychological judgment. Link the label to observable activity.

5. Consistency and active days

A company with twelve visits on one launch day differs from a company with twelve visits spread across three weeks.

Show active days, recency, and the distribution of activity through the period. For scheduled or monthly workflows, compare against expected opportunities rather than demanding daily use.

6. Concentration

Show whether usage depends on:

  • one company within the portfolio;
  • one user within the company;
  • one role;
  • one team;
  • one product area.

A top-user concentration chart should state whether it is based on meaningful actions, visits, or engaged time.

7. Pages and workflows used

Connect product-area summaries to grouped pages and meaningful events.

A product manager may need to know that an account uses Reporting. A designer may need to know that the account opens the Reports page repeatedly but never saves or schedules a report.

8. Users gaining or losing momentum

Show changes relative to each user’s prior pattern and the account’s peer context. Do not imply that a decline proves dissatisfaction or churn intent.

9. Relevant visits for investigation

Provide visits that explain an unusual account signal:

  • the session in which a workflow was first adopted;
  • recent visits from a declining user;
  • visits involving a repeatedly abandoned workflow;
  • the champion’s dominant workflow;
  • a visit from an account that is active but missing an expected outcome.

The company overview should reduce the distance from a metric to its evidence.

Segmentation and peer comparison

A global account average is rarely a fair benchmark for every customer.

Useful company attributes include:

  • plan;
  • company size;
  • lifecycle stage;
  • onboarding status;
  • industry;
  • region;
  • account age;
  • expected use case.

Other product-specific attributes may include entitlement, customer tier, integration status, or account owner.

Use segmentation to compare accounts that have a defensible reason to behave similarly. A newly onboarded startup should not automatically be compared with a mature enterprise account that has used the product for three years.

A useful peer group may be:

Plan = Growth
AND lifecycle stage = Onboarding
AND account age between 14 and 45 days
AND expected use case includes Reporting

That group can support questions such as:

  • Is this account’s adoption breadth unusual for its onboarding stage?
  • Are active-user counts low for companies of a similar size?
  • Is Reporting adoption missing among accounts that are expected and entitled to use it?
  • Is one region showing a product-area gap that the global average hides?

Keep peer groups large enough to be meaningful and privacy-conscious. Avoid presenting a comparison as a statistical conclusion when the segment contains only a handful of dissimilar accounts.

For customer-facing workflows, the same account evidence can support preparation for a check-in or onboarding review. It should complement, not replace, human context and the broader customer-success process.

Period calculations that commonly go wrong

Count distinct companies and users across the complete period

If the same company is active on ten days, it is still one active company for the complete period.

Do not calculate a 30-day unique-company total by adding thirty daily unique-company counts. The same account will be counted repeatedly.

Use:

COUNT(DISTINCT account_id)

over the complete selected period, after applying the valid-traffic rules.

The same applies to users.

Compare equal-length periods

A 28-day current period should normally be compared with the immediately preceding 28 days, not with a 31-day calendar month.

Equal lengths help control for:

  • number of weekdays;
  • number of weekends;
  • opportunity for recurring workflows;
  • ordinary volume differences caused by window size.

Also avoid comparing a partial current day or partial current week against a completed prior period without a clear warning.

Distinguish percentage change from percentage-point change

For a count:

Previous active users: 20
Current active users: 25
Percentage change: (25 − 20) ÷ 20 = 25%

For a rate:

Previous Reporting adoption: 35%
Current Reporting adoption: 45%
Percentage-point change: 45% − 35% = 10 percentage points
Relative percentage change: (45% − 35%) ÷ 35% ≈ 28.6%

Use the description that matches the question. Do not label a 10-percentage-point increase as a 10% increase.

When the previous value is zero, relative percentage change is undefined. Label the activity as new, or show the absolute change.

Use longer windows for low-frequency products

A daily operations tool may show meaningful change over seven or twenty-eight days. A quarterly planning or monthly reporting product may require sixty, ninety, or more days.

Choose a window based on the expected opportunity to use the workflow. A low-frequency customer should not be labelled inactive merely because the selected window is shorter than its normal cadence.

Define the account timezone

Active-day counts can change around midnight. Use a documented project, workspace, or reporting timezone and apply it consistently to current and previous periods.

Common implementation mistakes

Adding the company only to the user profile

This assigns all historical behavior to the user’s current company and fails for multi-account users.

Store event-time account context and maintain memberships separately.

Inferring accounts from email domains

Email domains do not reliably represent operating workspaces. Consultants, agencies, shared domains, subsidiaries, and personal addresses break the assumption.

Use explicit internal account IDs.

Treating raw URLs as features

Dynamic record IDs create artificial fragmentation and meaningless adoption rates.

Normalize routes and map them to grouped pages and product areas.

Counting every click as meaningful usage

A click may represent exploration, correction, navigation, or accidental interaction.

Define outcome-oriented and workflow-relevant events.

Summing daily unique counts

Daily unique users and companies cannot be added to produce complete-period unique counts.

Deduplicate across the entire reporting period.

Comparing unlike accounts

A startup in its first week and a mature enterprise account have different opportunities, entitlements, and expected workflows.

Use relevant peer attributes and lifecycle context.

Hiding the denominator

“Three product areas adopted” is ambiguous when one account is eligible for four and another for ten.

Show the eligible denominator.

Treating time as value

Long sessions can indicate deep work or unnecessary effort. Short sessions can indicate efficient completion or weak engagement.

Combine time with outcomes and evidence.

Rewriting history after an account merge

A merge can be a reporting rollup without changing the original event facts.

Preserve source IDs and document the rollup rule.

Leaving invalid traffic inside the model

Staff, demo, staging, support impersonation, and automated activity can dominate small datasets.

Exclude and monitor them explicitly.

Showing a signal without evidence

A company summary that cannot be traced to users, pages, and visits is difficult to trust and difficult to act on.

Preserve investigation paths.

Privacy, data minimization, and data quality

Company analytics does not require collecting every available property.

Capture only what supports a defined measurement or investigation need. In particular:

  • avoid passwords, secrets, access tokens, payment details, and unnecessary sensitive fields;
  • avoid sending free-form text unless its collection is specifically justified and protected;
  • allowlist event properties rather than collecting arbitrary page state;
  • mask or ignore sensitive selectors before recording or storage;
  • exclude sensitive routes and product areas before collection where possible;
  • separate durable behavioral IDs from direct contact attributes;
  • restrict access to identifiable user and account views;
  • define deletion and retention behavior intentionally.

Data-protection principles such as purpose limitation, data minimization, and storage limitation should shape the event design rather than being treated only as a policy layer added later.

Behavioral event facts and mutable company attributes often have different retention and access needs. Keeping them logically separate can reduce unnecessary duplication and make historical interpretation clearer.

Privacy rules also affect data quality. If a selector is masked, a route is excluded, or an event property is ignored, dashboards and session evidence should reflect that limitation rather than silently implying complete capture.

Monitor at least:

  • percentage of authenticated events missing user IDs;
  • percentage of events missing account IDs;
  • unknown normalized pages;
  • invalid session boundaries;
  • duplicate event IDs;
  • late-event volume;
  • excluded internal traffic;
  • account mappings changed by merges or splits;
  • feature mappings changed by product releases.

The objective is not maximum capture. It is sufficient, trustworthy evidence for the questions the team has chosen to answer.

How Hymetry measures product usage by company

Hymetry is account-centric product intelligence for B2B SaaS. It connects product behavior across Pages, Companies, Users, and Visits so a team can move from a company-level signal to the people, workflows, and sessions behind it.

Pages organizes product structure and adoption

Pages organizes raw and normalized product paths into grouped pages and product areas.

This supports questions such as:

  • Which companies use a grouped page?
  • How broad is adoption across product areas?
  • Which users inside adopting accounts participate?
  • Which pages are growing or declining?
  • Which exact source activity supports the pattern?

Grouped pages provide the stable analytical level. Raw normalized pages remain available when exact action evidence matters.

Companies summarizes customer-level usage

Companies brings account context together:

  • active users;
  • adoption breadth;
  • visits;
  • engaged time;
  • usage trends;
  • pages and product areas used;
  • account attributes and relevant segments.

The company view is intended to show a reviewable account pattern, not merely a login count or an unexplained score.

Users explains participation and concentration

Users shows who is producing the account total.

That makes it possible to distinguish:

  • broad team participation;
  • a strong champion with little backup;
  • new users gaining momentum;
  • light or passive usage;
  • previously active users whose activity has dropped.

User behavior remains connected to the company and product areas in which it occurred.

Visits supplies session evidence

In Hymetry, a Visit is the session-level evidence layer. A page visit is a continuous period spent on one page within that session.

Visits connect:

  • the user and company;
  • ordered pages and product areas;
  • event timing;
  • engaged activity;
  • the source session available for investigation.

Aggregate analytics should identify the visit worth reviewing rather than requiring a team to watch random recordings.

Hymetry does not automatically know customer intent, prove why a user behaved a certain way, or guarantee churn prediction. Company, user, page, and visit signals help a person decide what deserves attention and inspect the evidence behind it.

Frequently asked questions

What is account-level product usage?

Account-level product usage is valid product behavior aggregated by a stable company, account, workspace, tenant, or other operating group. A reliable model preserves the users, visits, pages, features, and product areas that contributed to each account total.

Should the account ID be stored on the user or on the event?

Use both an explicit user-to-account relationship and the account context on the event. The relationship describes membership. The event records the workspace or account active when the action occurred.

A current company_id on a user profile is not enough for multi-account users or historical reporting.

How should a product handle one user in multiple companies?

Maintain a many-to-many membership model and send the active account or workspace ID with each event. When the user switches account context, split the visit or ensure subsequent events are attributed to the new account.

Do not infer all activity from the user’s latest membership.

What should count as an active company?

A defensible baseline is a company with at least one valid product visit during the selected period. The word “valid” should exclude staff, staging, demo, automated, and other invalid traffic according to documented rules.

For a specific workflow, use a separate qualifying event rather than redefining the portfolio-wide active-company metric.

Do company analytics require sessions?

Basic account counts can be calculated from correctly attributed events. Sessions add sequence, continuity, account-switch boundaries, engaged-time context, and a direct path to investigation.

Without sessions, a team can know that actions happened but has less evidence about how they formed a workflow.

What is a good top-user concentration?

There is no universal threshold. Interpret concentration relative to:

  • the company’s size;
  • the number of eligible users;
  • the product’s normal role structure;
  • the account’s historical pattern;
  • comparable peer accounts;
  • the metric used for the calculation.

A high concentration can represent a healthy specialist workflow, an emerging champion, or a fragile dependency. Review the users and visits before deciding.

How often should company usage be measured?

Match the window to the product’s expected cadence. High-frequency operational products may support weekly or rolling 28-day views. Monthly or quarterly workflows require longer windows.

Always show the selected period and compare it with an equal-length, completed period where possible.

Does more engaged time mean the customer receives more value?

Not by itself. Engaged time is observed active product time, not proof of value or attention. Interpret it alongside meaningful outcomes, product-area breadth, active days, user participation, and session evidence.

Build the model from evidence upward

Measuring B2B SaaS product usage by company is not a final aggregation step added after user analytics. It starts with the identity and event model.

Choose the correct operating account. Use stable IDs. Preserve the workspace active at event time. Normalize product structure. Build visits. Calculate complete-period metrics. Compare similar accounts. Keep every company-level summary connected to its users, workflows, and source evidence.

That foundation makes it possible to see the difference between volume and distribution, activity and adoption, a healthy team workflow and one-person dependence.

Sources

About Hymetry

Hymetry is account-centric product intelligence for B2B SaaS. It helps teams understand how customer companies and the users inside them adopt and use their product.