Key differences
| Criterion | HockeyStack | Mixpanel | Amplitude |
|---|---|---|---|
| Primary category | B2B GTM, revenue intelligence, attribution | Focused product and behavioral intelligence | Broad product and digital-intelligence platform |
| Primary entity | Account, contact, opportunity, deal, campaign, touchpoint | User/device; company or workspace with Groups | User/device; account or group with Accounts |
| Commercial journeys | Strong | Requires CRM and pipeline integration | Requires CRM and pipeline integration |
| Product behavior | Available from telemetry, but not primary | Strong | Strong |
| Retention and cohorts | Limited or GTM-oriented | Strong | Strong |
| Account analytics | Commercial account intelligence | Product behavior with paid Group Analytics | Product behavior with Accounts package |
| Replay | Not documented in reviewed current materials | Web and supported mobile | Native, plan-dependent |
| Experiments and flags | Not documented as native product packages | Separately priced Enterprise add-ons | Native with limited entry access and expanded packages |
| Main limitation | Not deep general-purpose product analytics | Commercial opportunity context is not automatic | Broad surface is not CRM-native attribution |
“Account analytics” is not one job: HockeyStack means buying committees, opportunities, and GTM signals; Mixpanel and Amplitude primarily mean product behavior grouped by a company, workspace, or account key.
Decision by scenario
| Scenario | Start with | Likely companion | Main caveat |
|---|---|---|---|
| Demand generation and campaign ROI | HockeyStack | CRM, warehouse, product analytics | Attribution assigns credit; it does not prove causality |
| Product-growth team | Mixpanel; Amplitude for broader needs | CRM and warehouse | Commercial opportunity context requires modeling |
| Sales-assisted PLG | Mixpanel or Amplitude plus HockeyStack | CRM and shared warehouse | Two layers need disciplined shared identity |
| Enterprise product program | Amplitude | Warehouse and specialist systems | Complexity and custom packages may exceed narrower needs |
| Onboarding improvement | Mixpanel | Replay and experiments by package | Correct instrumentation comes first |
| Renewal account adoption | Mixpanel Groups, Amplitude Accounts, or Hymetry | CRM or CS platform | Usage is a renewal signal, not a guarantee |
Commercial journeys versus product behavior
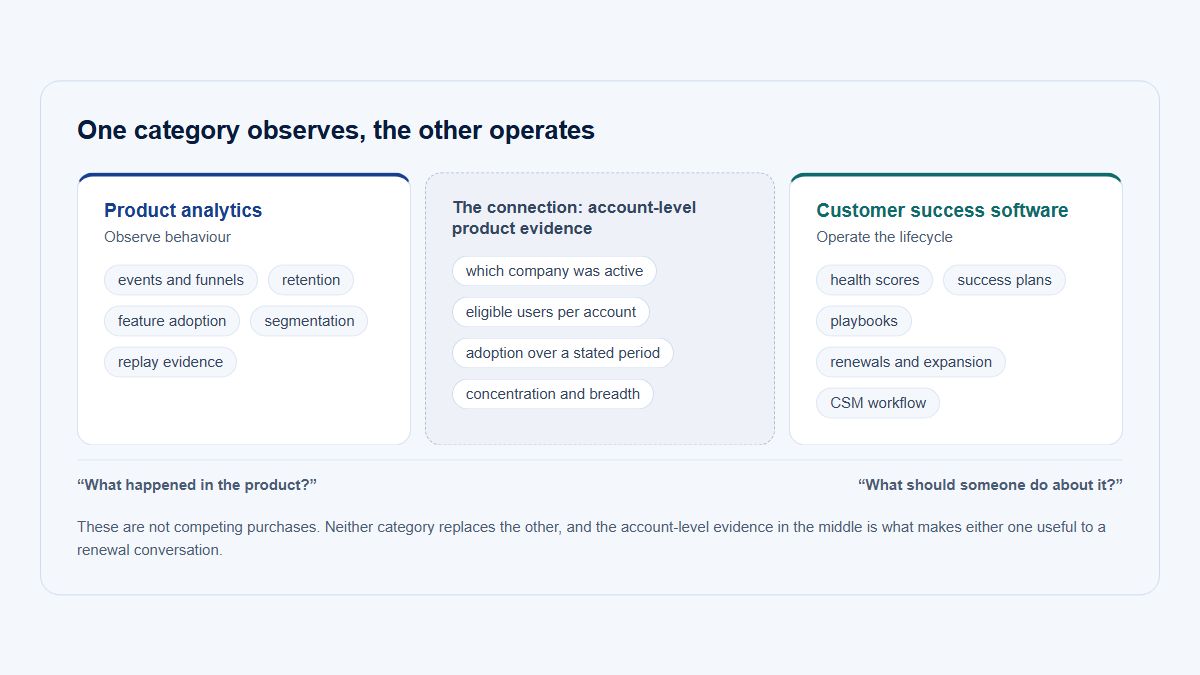
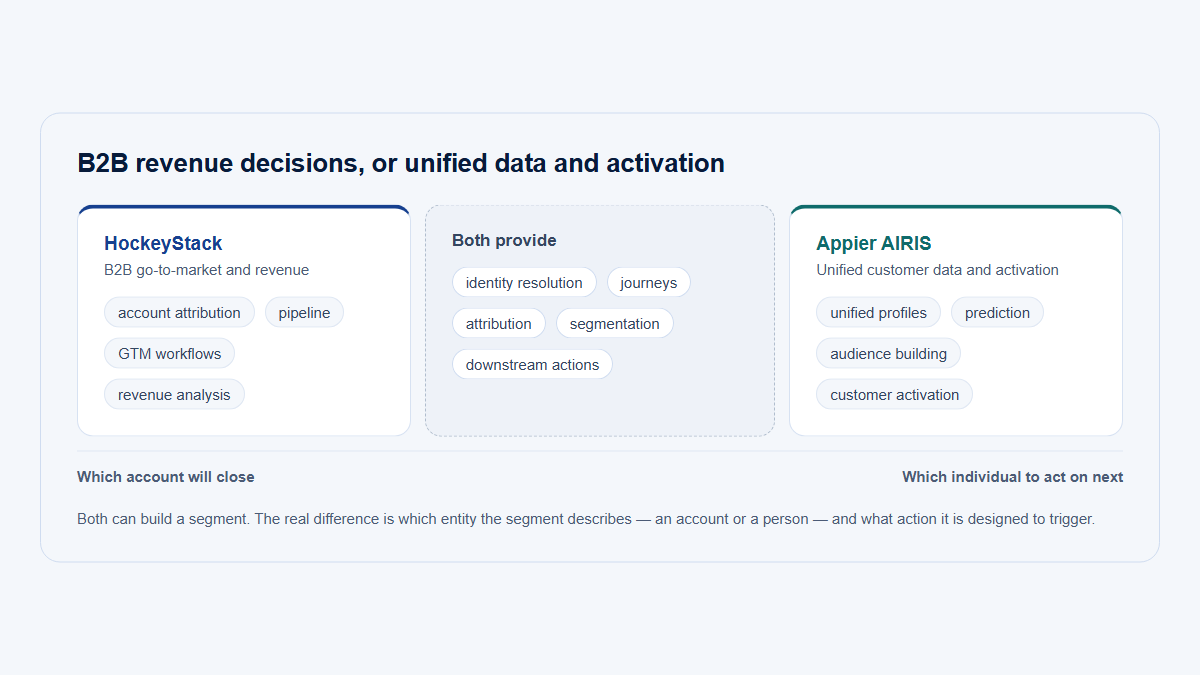
Revenue analytics asks which campaigns and sales touches appeared before an opportunity, which contacts participated, how pipeline changed, and how a selected attribution model distributes credit. Product analytics asks which actions occur, where users abandon, who returns, which features become adopted, how cohorts differ, and what changed after an experiment. A campaign touch, CRM opportunity, product event, active company, subscription, and renewal are different objects.
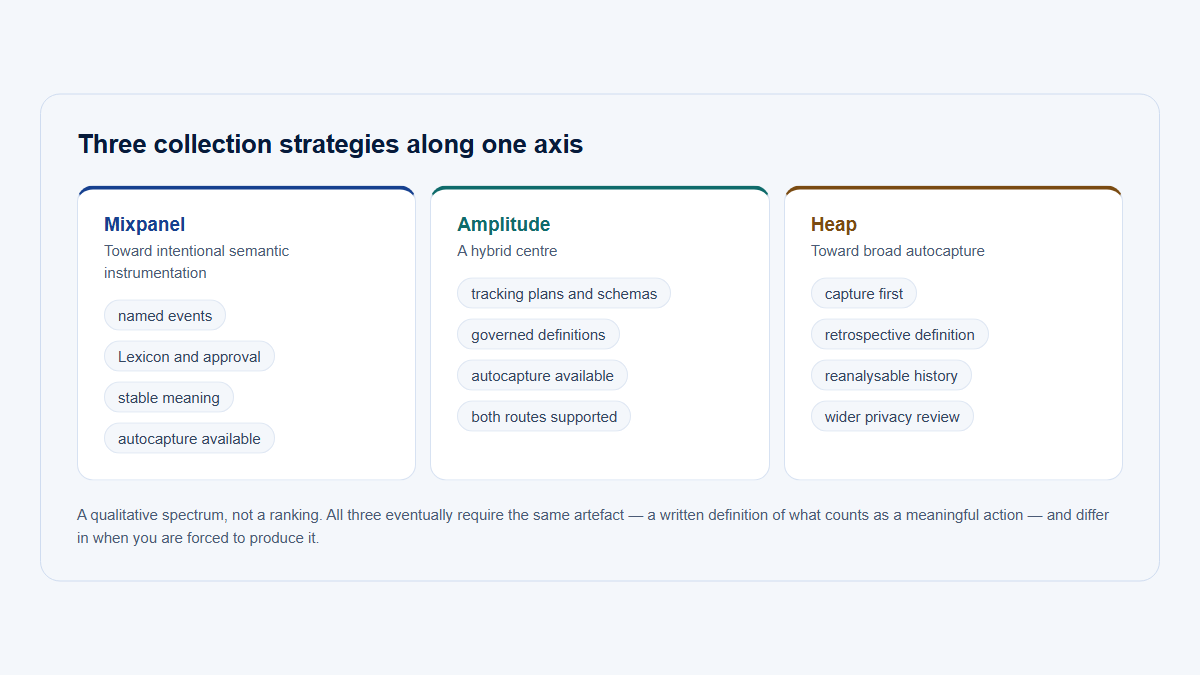
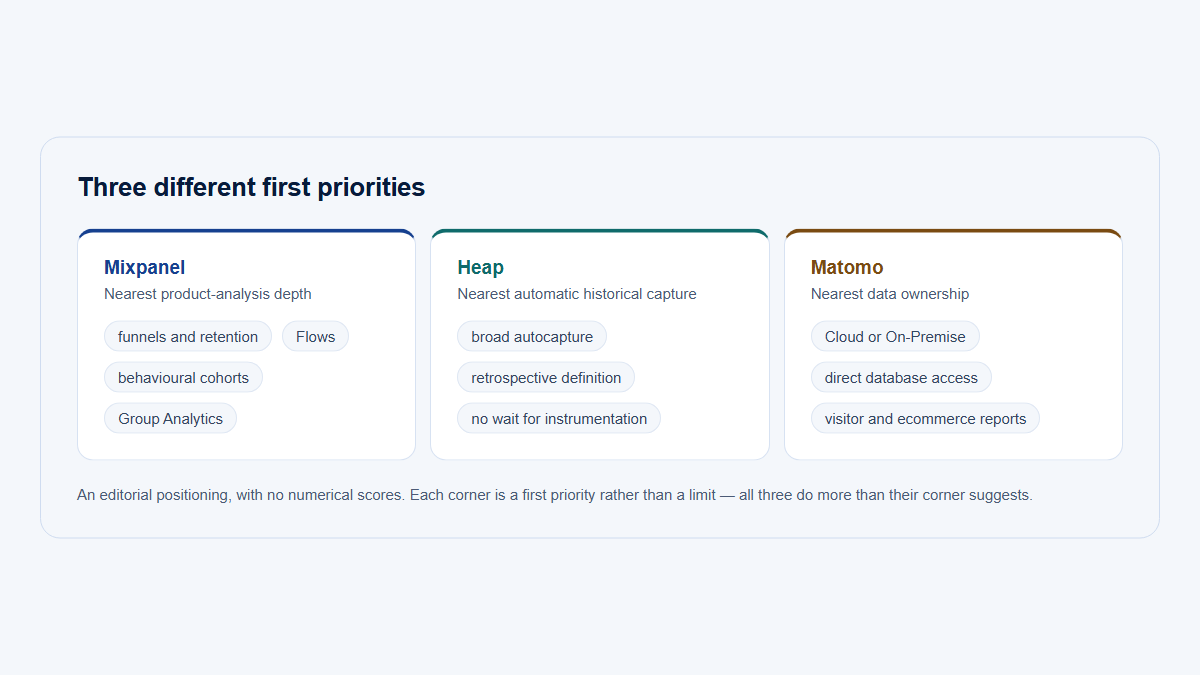
HockeyStack starts with the B2B buyer and revenue journey, combining CRM, advertising, automation, website, sales activity, account signals, and warehouse data. Mixpanel starts with user and device events, then adds profiles, funnels, retention, flows, replay, groups, attribution, experiments, flags, and revenue analysis. Amplitude starts with events and users but extends further into replay, experiments, feature management, guides, surveys, activation, connections, and enterprise governance.
Define shared commercial identity explicitly
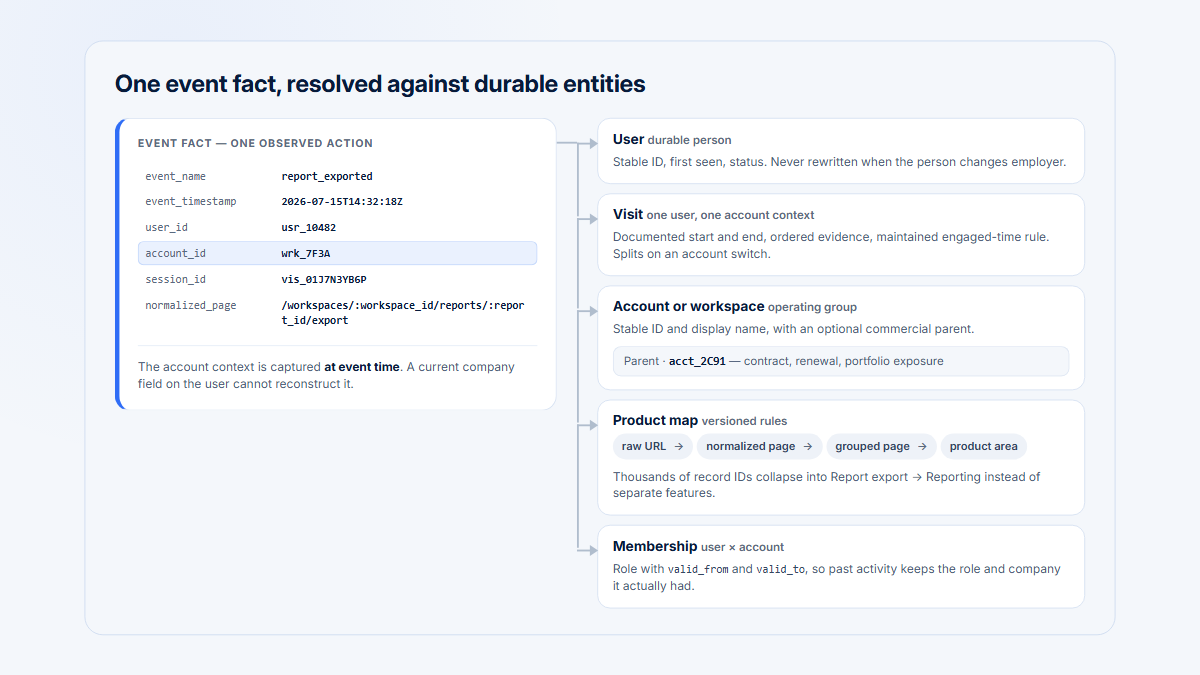
Shared identity must specify anonymous visitors, known users, contacts, companies, workspaces, accounts, opportunity relationships, and membership over time. A shared warehouse can connect layers, but it cannot automatically reconcile definitions, retroactively create missing group keys, or establish causality.
Attribution is not causation
First-touch, last-touch, multi-touch, custom, and predictive models distribute credit under assumptions. They do not observe what would have happened to the same account without a touchpoint. Experiments or carefully designed quasi-experiments provide stronger causal evidence.
Behavior is not a commercial outcome
Product use can be associated with conversion, expansion, or retention and can help prioritize accounts. It does not guarantee purchase, renewal, or expansion. Validate, calibrate, segment, and interpret predictions with commercial and customer context.
Implementation and pricing
HockeyStack needs CRM object and stage definitions, channel normalization, correct source connections, touchpoint policy, buying-committee identity, attribution-model and lookback choices, and reconciliation with finance. Mixpanel needs event governance, identity, group keys, exposure events, replay privacy, and volume control. Amplitude needs those product foundations plus package, portfolio, permissions, experiment, guide, activation, account, and governance ownership.
HockeyStack
No public free product tier, standard trial, entry price, or usage rate was identified. Demo access and a separate free account-research tool were available.
Every plan was described as including GTM and CRM integrations, hands-on support, and custom setup for complex environments. Get terms in writing.
Mixpanel
Free forever; Growth starts at $0. The first 1 million monthly events on Growth were free, then the public standard rate was $0.28 per 1,000 events before volume discounts.
Free included 10,000 monthly replays; Growth and Enterprise included 20,000. Advanced products have package or add-on rules.
Amplitude
Free and Plus start at $0; the first 2 million monthly events on Plus were free. Growth and Enterprise use custom pricing.
Free included 10,000 monthly replays, Growth 20,000, and Enterprise 50,000. Accounts and expanded experiments or replay are separately packaged.
Verified August 7, 2026. Total cost includes events, accounts, CRM history, integrations, replay, experiments, flags, warehouse work, exports, implementation, governance, privacy, and recurring reconciliation.
HockeyStack
Approximately 82 reviews; materially smaller than the other two samples.
Mixpanel
Approximately 1,371 reviews.
Amplitude Analytics
Approximately 2,972 product-specific reviews.
Identical averages do not show equal performance: reviewers evaluated different categories, company sizes, implementations, and jobs. Review samples cannot establish attribution accuracy, causal outcomes, ROI, or universal fit.
Current videos and walkthroughs
The two selected videos are orientation material, not neutral proof of product performance.
Which should you choose?
| Choose | When it is the strongest fit | Validate before signing |
|---|---|---|
| HockeyStack | Revenue teams need marketing and sales touchpoints connected to pipeline, opportunity, and GTM reporting. | Attribution assumptions, CRM completeness, identity joins, workflow scope, and quote terms. |
| Mixpanel | Product teams need focused event analysis, funnels, retention, flows, cohorts, and group-level reporting. | Account modeling, governance, replay coverage, warehouse movement, and usage-tier cost. |
| Amplitude | You need broader product analytics with governed data workflows and adjacent experimentation or engagement capabilities. | Suite packaging, account instrumentation, permissions, data quality workflow, and contracted scale. |
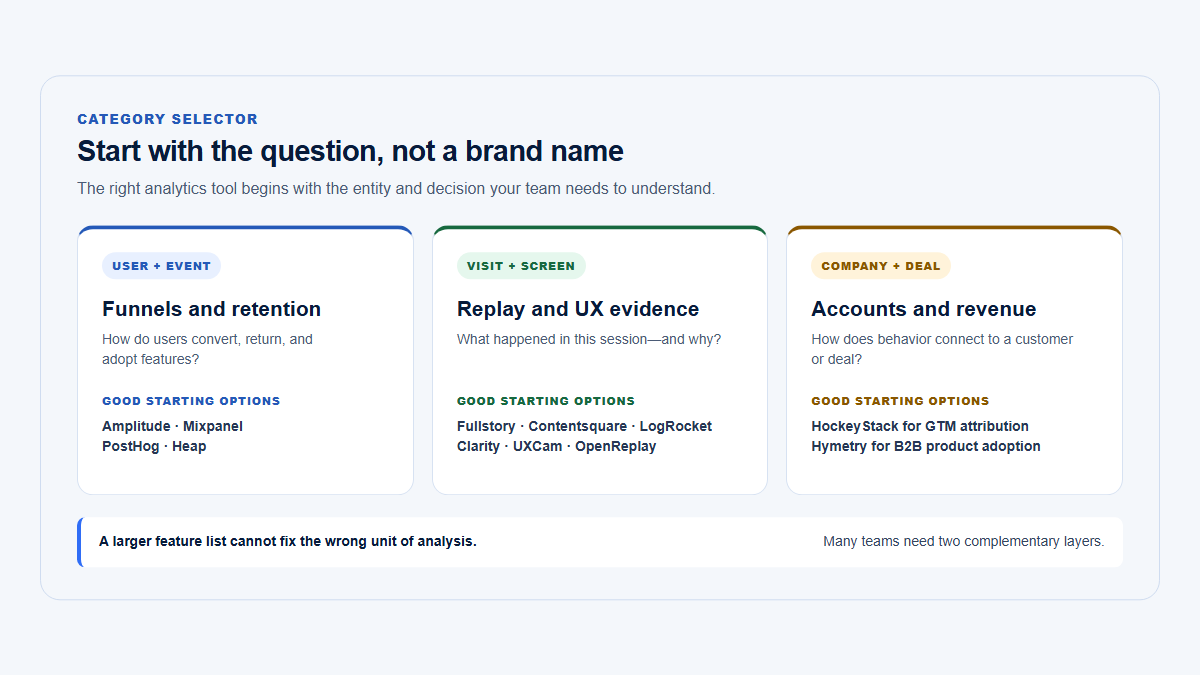
Decision rule: select HockeyStack for GTM attribution, Mixpanel for focused behavioral analysis, or Amplitude for a broader product-data program—then test the same account joins and decision workflow in production-like data.
Where Hymetry fits
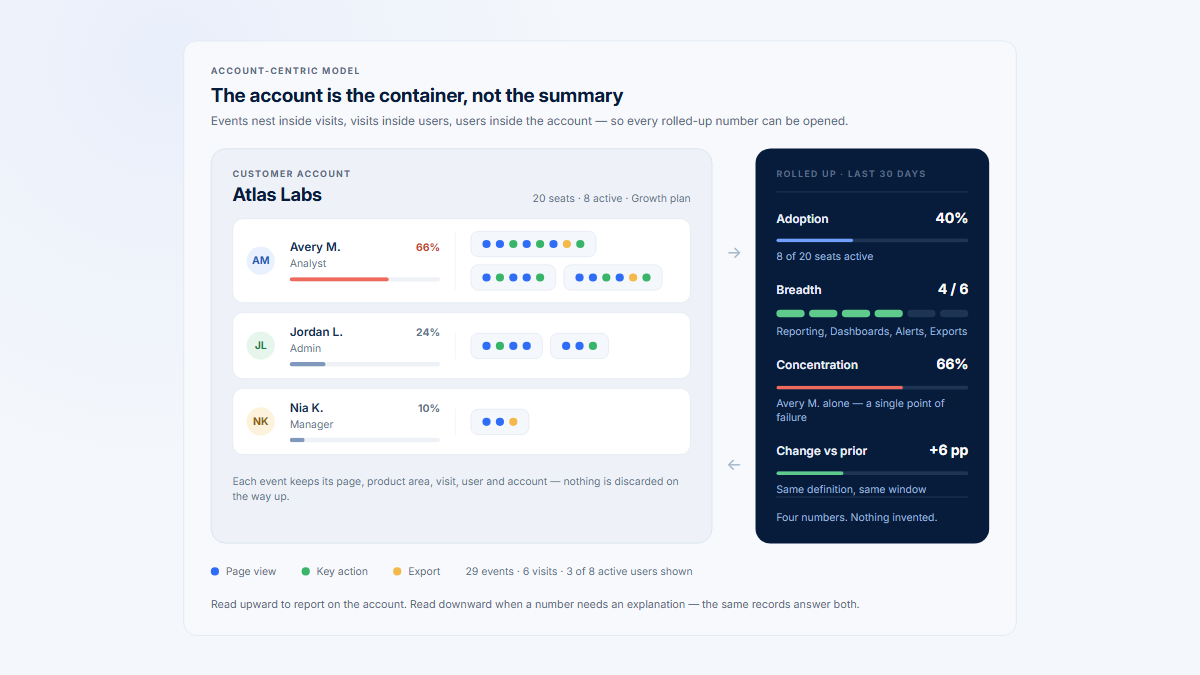
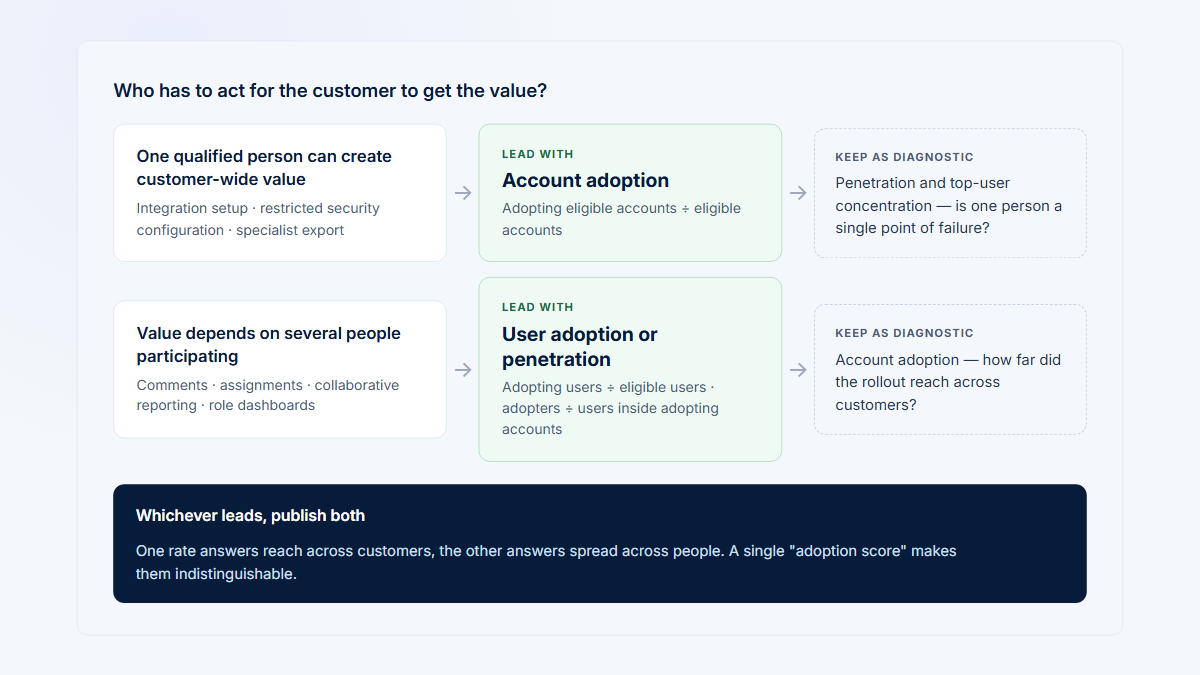
Hymetry connects product usage across Pages, Companies, Users, and Visits for account adoption, adoption breadth, user concentration, and session evidence. It can complement HockeyStack: HockeyStack shows campaigns and sales touches around an opportunity, while Hymetry shows whether the resulting customer adopted a workflow broadly and which visits merit review.
Hymetry may also be a narrower alternative to a larger Mixpanel or Amplitude program when account usage, grouped product areas, participation, and visit evidence are the main needs. Its analytical breadth and ecosystem are smaller; it is newer, has fewer integrations, has no mature independent rating, and does not replace CRM, attribution, pipeline, forecasting, advertising analysis, advanced experiments, enterprise data infrastructure, or a customer-success workflow platform.
Frequently asked questions
Is HockeyStack a product analytics platform?
It can ingest product telemetry and connect it to accounts, opportunities, pipeline, and revenue, but its primary position is GTM and revenue intelligence—not deep general-purpose product analytics.
Can HockeyStack replace Mixpanel?
Only when the real requirement is commercial journey analysis. It is not a like-for-like replacement for event exploration, retention, flows, replay, company behavior, or experiment reporting.
Is Mixpanel better than Amplitude?
Neither is universally better. Mixpanel is more focused with transparent entry pricing; Amplitude is broader with more native platform areas and enterprise governance.
Which is best for B2B attribution?
HockeyStack is the strongest starting point of these three for B2B account journeys, CRM-connected pipeline, multi-stakeholder touchpoints, and revenue attribution.
Which supports session replay?
Mixpanel and Amplitude support replay. Current HockeyStack materials reviewed did not establish a native in-product replay product as of August 7, 2026.
Can attribution prove which touchpoint caused a sale?
No. Attribution assigns credit according to a model; it does not observe the counterfactual. Experiments or carefully designed quasi-experiments provide stronger causal evidence.
Sources
Disclosure: Hymetry publishes this comparison and is mentioned only where its account-centric B2B product model is relevant. Product capabilities, prices, ratings, integrations, and videos are verified against linked sources and may change after publication. Attribution and behavioral associations should not be interpreted as automatic proof of causality.
Methodology: This is a cross-category editorial comparison, not a controlled benchmark. Research and final verification were completed . Official product, data-model, identity, integration, and pricing sources came first; G2 supplied the common ratings source; recent independent reviews were secondary; videos were orientation only. “Not documented” followed review of multiple current official areas, not absence from one pricing table.
HockeyStack official sources
Mixpanel official sources
Amplitude official sources
Ratings and videos
Additional references from the original article
- Attribution models
- Simplified user identification
- Integrations directory
- Warehouse Connectors
- Carnegie Mellon University, causal inference notes
- G2
- G2
- G2
- G2
- Billing and pricing documentation
- Explore company usage in the demo
- HockeyStack homepage
- Data Syncs
- Attribution lookback window
- Custom attribution weights
- Predictive attribution model
- Group and Company Analytics FAQ
- Multi-touch attribution through computed properties
- Salesforce Group integration
- HubSpot integration
- Guides and Surveys documentation
- HockeyStack review, ZoomInfo Pipeline
- Mixpanel review, Work Management
- Amplitude Analytics review, Work Management
- UC Berkeley, experiments and confounding
- UC Berkeley, causal inference from data
- GTMnow episode page
- customer health scores
- product usage and expansion opportunities
- product usage before a renewal meeting
- at-risk accounts and product usage
- peer baselines for B2B SaaS