Menu
Account and user health

How to Identify At-Risk Accounts from Product Usage

Learn how to identify account-level usage changes worth investigating without treating product activity as a deterministic churn prediction.

What is an at-risk account?

An at-risk account is a customer account showing a meaningful product-usage change, adoption gap, workflow problem, or dependency that may threaten continued value and therefore deserves contextual review.

The phrase is operational. It tells a product, customer-success, or account team where to investigate next. It does not describe a known customer intention.

A product-usage risk state does not automatically mean:

  • the account will churn;
  • the customer is dissatisfied;
  • the account has stopped paying;
  • a user champion is leaving the customer;
  • the product caused the behavioral change;
  • the customer no longer receives value;
  • an automated outreach sequence should begin immediately.

An account may be flagged because its activity narrowed, because fewer users participate, because a recurring workflow disappeared, or because selected sessions show blocked progress. Each observation can be useful without proving why it happened.

This distinction matters because teams often use “at risk” to describe several different concepts:

Concepts commonly described as “at risk” and their interpretation limits.
ConceptWhat it describesAppropriate useWhat it cannot establish by itself
Current usage stateHow much relevant product use is visible nowDescribing adoption, activity, breadth, and participation in the current periodWhether the account is improving or declining
MomentumHow comparable behavior changed over timeFinding account engagement decline or growing adoptionWhether the current level is appropriate for the account
Account fragilityDependence on too few users, roles, or workflowsFinding concentration and missing backup coverageWhether a highly active user intends to leave
Product frictionEvidence that users fail to progress through an expected workflowPrioritizing setup, permission, usability, or reliability investigationWhether friction caused a commercial decision
Commercial riskBudget, procurement, contract, pricing, competition, or organizational decisionsRenewal and account planningWhat is happening inside the product unless other evidence is connected
Validated churn predictionA tested estimate of a defined future outcome over a defined horizonForecasting after appropriate out-of-sample validationCausal explanation or certainty about an individual account

For a broader framework that combines several product-usage dimensions, see the customer health score guide. This article stays focused on the investigation process behind an account-level usage flag.

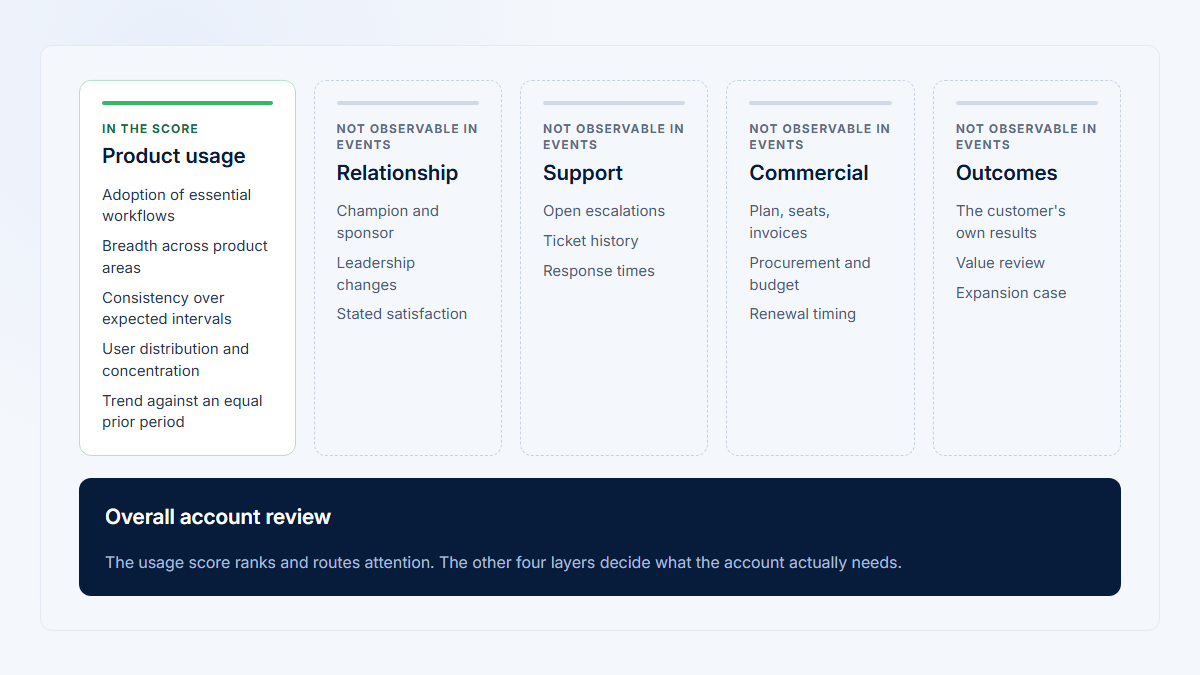
Product-usage risk is only part of complete customer risk

Product analytics observes behavior inside the product. A complete customer review may require several additional evidence layers.

Evidence layers in a complete customer-risk review.
Risk layerWhat it coversExample evidence
Product-usage riskAdoption, meaningful activity, recurrence, users, concentration, workflow completion, and observed frictionFewer active users, lost product areas, repeated incomplete workflows
Relationship riskStakeholder engagement, sponsorship, communication, and executive alignmentMissed meetings, an unresponsive sponsor, no identified backup stakeholder
Support or service riskUnresolved incidents, implementation problems, service delivery, and escalationsA severe open issue, repeated support contacts, delayed implementation
Commercial riskBudget, procurement, contract, pricing, competition, and organizational decisionsA spending freeze, vendor consolidation, legal review, renewal negotiation
Outcome riskWhether the customer is achieving the result it bought the product to produceMissing business outcomes, incomplete rollout, no realized operational change

Customer-health methodology commonly combines product usage with support, relationship, sentiment, and commercial information.12 That describes common practice; it does not prove that a particular combination predicts churn.

Product analytics therefore covers only one part of the complete account picture. It can show that Reporting disappeared, participation fell from six users to two, or a workflow repeatedly failed. It cannot independently show whether the account has a budget problem, whether an executive sponsor changed strategy, or whether the customer considers the product valuable.

A responsible account review keeps these layers separate long enough to understand the problem. “Product usage declined” and “the renewal is at risk” may both be true, but they are not the same statement.

Separate current usage state from change over time

A current-period snapshot and a trend answer different questions.

Current state asks what the account is doing now. It may include:

  • meaningful activity;
  • active users;
  • adoption breadth;
  • recurring use;
  • product-area coverage;
  • workflow completion;
  • top-user concentration.

Change or momentum asks what moved. It may include:

  • declining active days;
  • lost product areas;
  • reduced user participation;
  • a longer inactivity gap;
  • lower workflow completion;
  • rising concentration;
  • disappearing role coverage.

Keep these dimensions visible rather than blending them into one label.

An account can be:

  • currently active but declining;
  • currently light but stable and appropriate;
  • below peers but improving;
  • above peers but losing momentum;
  • inactive because no expected usage opportunity occurred;
  • broad in product coverage but dependent on one person;
  • narrow in coverage because its purchased use case is intentionally specialized.

A high current state does not cancel a negative trend. A low current state does not automatically create risk. A newly onboarding account can have narrow adoption and strong momentum, while a mature account can remain above the peer median even as several previously adopted workflows disappear.

The most useful sequence is:

  1. Describe the account’s current state.
  2. Measure comparable change.
  3. Identify which component moved.
  4. Add lifecycle, cadence, eligibility, and opportunity.
  5. Decide whether the remaining unexplained change deserves review.

For the underlying account measurement model, see how to measure product usage by company.

Matrix separating an account’s current usage state from declining, stable, or improving momentum.
Current state and momentum answer different questions; either can change the review priority.

Core product-usage risk signals

No one signal identifies at-risk SaaS customers reliably in every product. Treat these product usage health signals as customer risk indicators for investigation, not proof of B2B SaaS churn risk. Use several signals, preserve their limitations, and investigate combinations that make sense for the account.

Decline in meaningful activity

Compare actions, completed workflows, or outputs that represent the account’s intended value—not every event.

A reporting product might count reports completed, reviewed, or shared. A project-management product might count tasks completed, project updates, or recurring planning actions. An administration page view may be useful context but should not automatically carry the same meaning as a completed core workflow.

The HEART framework’s goal–signal–metric discipline is useful here: define the product goal first, decide what observable behavior would support it, and only then choose the metric.3

A decline in meaningful activity may indicate softer use. It may also reflect a completed project, a holiday, fewer legitimate opportunities, a role change, an instrumentation problem, or a more efficient workflow.

Reduced adoption breadth

Adoption breadth asks how much of the relevant product the account uses.

A mature account that previously used Dashboard, Reporting, Collaboration, and Integrations but now uses only Dashboard has lost workflow coverage. That contraction may be more informative than a modest change in total events.

Breadth must respect eligibility. A product area unavailable on the customer’s plan, irrelevant to its use case, or restricted to a role should not count as a missing adoption opportunity.

Lower consistency

Consistency measures whether meaningful use appears in the periods where it is expected.

For a daily workflow, active weekdays may be useful. For a monthly reporting workflow, successful monthly cycles matter more than active days. For an event-driven product, consistency may mean use whenever a qualifying event occurs rather than use every week.

Lower consistency warrants review when comparable opportunities existed and the account no longer completes the expected workflow.

Increased recency gap

Recency is the time since the last meaningful account activity.

A growing gap can be useful, but only relative to expected cadence. Seven inactive days may be unusual for daily operations and entirely normal for monthly reporting.

Prefer “time since the last expected meaningful action” over “time since any login.”

Falling active-user participation

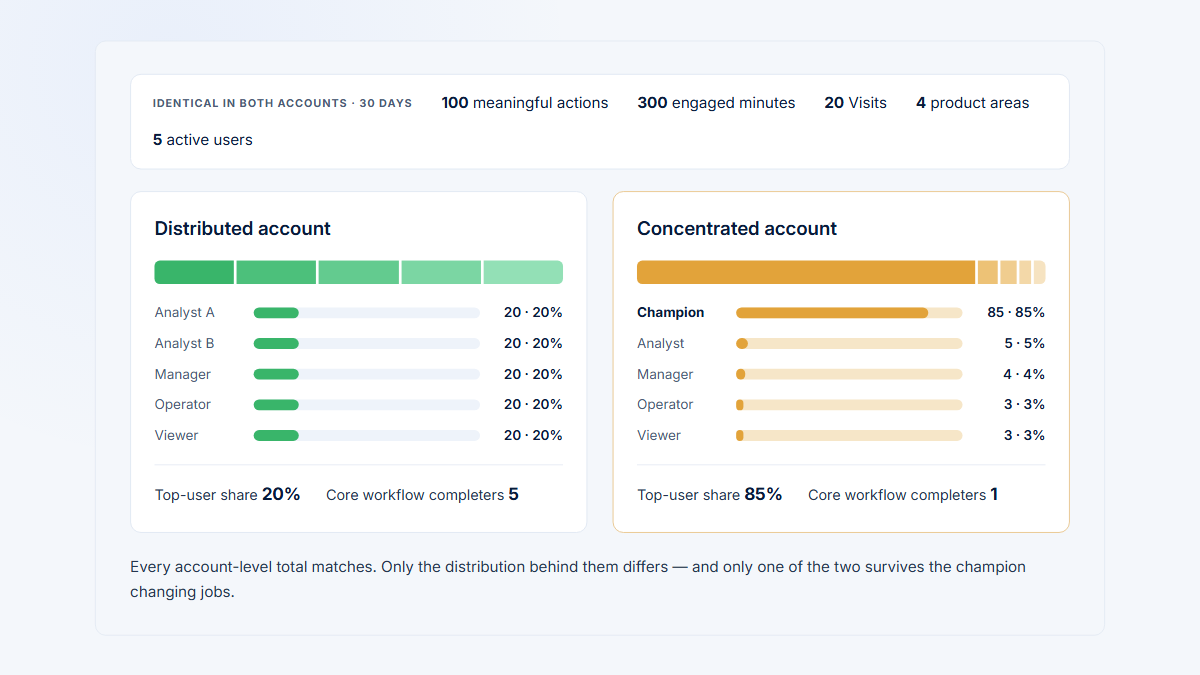
Account totals can remain stable while fewer people contribute.

Track distinct active users, relevant role participation, and the share of eligible users completing meaningful workflows. When six contributors become two, the account may be becoming more fragile even if the two remaining users preserve the total volume.

User-state definitions should remain behavioral and inspectable. See the guide to user engagement status definitions for a more detailed treatment of active, light, passive, dropped, at-risk, and gaining-momentum users.

Rising top-user concentration

Top-user concentration measures how much meaningful account activity belongs to the most active person.

A rising rate can expose dependency that aggregate activity hides. If one person now produces 76% of meaningful activity, the account may have less resilient role coverage than it did when six users participated.

Some products are legitimately specialist-led, so concentration is not automatically bad. Interpret it alongside expected roles, account size, permissions, and workflow ownership.

For a deeper treatment, see how to identify champion concentration risk.

Lost champion or role coverage

A previously central user may stop contributing, or an expected role may disappear from the workflow.

Describe the observed behavior precisely:

A previously central Reporting user has no qualifying activity in the current period, and no other user has taken over that workflow.

Do not infer that the person left the company, became dissatisfied, or stopped supporting the product. Those explanations require additional account context.

Repeated incomplete workflows

When instrumentation defines a start and a meaningful completion, repeated starts without completion can identify a workflow worth reviewing. Funnel analysis is designed to show how users progress or fail to progress through defined steps.2

Look for patterns across multiple opportunities or Visits. One incomplete session can reflect a changed goal, interruption, or exploratory behavior.

Setup or permission barriers

An account may appear inactive because eligible users cannot reach the required state.

Useful evidence may include:

  • an incomplete setup sequence;
  • repeated navigation between settings and permissions;
  • an observed authorization error;
  • invited users who cannot access the relevant product area;
  • a required integration that remains incomplete.

Confirm the barrier before calling it a product problem. Missing activity alone does not establish a permission issue.

Declining recurring use

Adoption and recurrence are different.

An account can adopt a workflow once but stop repeating it. When a previously recurring action disappears across comparable opportunities, inspect whether the workflow remains relevant, moved elsewhere, became automated, or is blocked.

A one-time configuration workflow should not be penalized for not recurring after successful completion.

Peer deviation

A relevant peer comparison can reveal whether an account behaves unusually for its plan, lifecycle, account size, use case, integration status, and expected cadence.

Start with the account’s own history. Then compare it with a sufficiently similar peer group. A global median can hide the difference between onboarding and mature accounts or between human-operated and integration-led workflows.

A peer median is a reference, not a target every account must reach. See the guide to peer baselines in B2B SaaS.

Unexpected substitution

Usage can disappear from one interface because the work moved to:

  • an API;
  • an integration;
  • a scheduled export;
  • another product feature;
  • a delegated administrator;
  • an external process.

Before labeling a decline as customer usage risk, check whether outputs remain stable through another path. A customer may receive the same value with fewer interface actions after automating a workflow.

Substitution is especially important when a steep UI decline appears without a corresponding decline in completed outputs.

Diagram showing product-usage signals and account context feeding an investigation priority rather than a churn prediction.
Product-usage signals become useful only when their components and account context remain visible.

Transparent signal definitions and formulas

These formulas are account-level investigation signals. They are not a complete risk model and do not produce a validated churn probability.

Use comparable periods. The default may be a current period and the immediately preceding period of the same length, but cadence-specific cycles are often more appropriate.

Meaningful-activity change

Percentage change

Percentage change = ((current meaningful activity − previous meaningful activity) ÷ previous meaningful activity) × 100

Worked calculation

((810 − 825) ÷ 825) × 100 = −1.8%

The definition of meaningful activity must be documented. It may be a completed workflow, a role-appropriate output, or another event tied to the intended product value.

The zero-baseline problem

When previous meaningful activity is zero, percentage change is undefined. Do not display infinity or an arbitrary percentage.

Use one of these alternatives:

  • show New activity from a zero baseline;
  • display the absolute change;
  • compare against a longer historical baseline;
  • evaluate activation milestones;
  • mark the account as having insufficient history.

Adoption-breadth change

Breadth change

Breadth change = current adopted product areas − previous adopted product areas

Worked calculation

1 current adopted area − 3 previous adopted areas = −2 areas

Document what qualifies a product area as adopted and which areas are eligible for the account.

Active-user change

Active-user change

Active-user change = current distinct active users − previous distinct active users

Worked calculation

2 current distinct active users − 6 previous distinct active users = −4 users

Deduplicate users over the complete period. Do not add daily unique-user counts to calculate a longer-period distinct count.

Top-user concentration

Top-user concentration

Top-user concentration = (meaningful activity from the most active user ÷ total meaningful account activity) × 100

Worked calculation

(616 ÷ 810) × 100 = 76.0%

When comparing concentration rates, use percentage-point change:

Concentration-rate change

76% current concentration − 34% previous concentration = +42 percentage points

Do not describe this as a 42% increase. Percentage points compare the rates directly.

Retained product areas

Retained-area rate

Retained-area rate = (product areas used in both current and previous periods ÷ product areas used in the previous period) × 100

Worked calculation

Areas used previously = Dashboard, Reporting, Collaboration
Areas used in both periods = Dashboard
(1 retained area ÷ 3 previously used areas) × 100 = 33.3%

This metric shows whether previously adopted coverage remained. It does not explain why an area disappeared.

Opportunity-adjusted recurrence

Opportunity-adjusted recurrence

Opportunity-adjusted recurrence = (eligible intervals with qualifying use ÷ eligible intervals with a realistic opportunity) × 100

Worked calculation

(6 monthly cycles with a completed report ÷ 6 eligible monthly reporting cycles) × 100 = 100%

This avoids penalizing an account for periods in which no realistic opportunity occurred.

Every signal definition should record:

  • the numerator and denominator;
  • the qualifying event or workflow;
  • the time window;
  • eligibility rules;
  • opportunity rules;
  • cadence;
  • identity requirements;
  • treatment of automated activity;
  • missing-data behavior;
  • definition version.

Expected cadence and realistic opportunity

A risk rule should ask whether the account had a realistic opportunity to use the workflow.

Evaluation units for workflows with different expected cadences.
Workflow typeBetter evaluation unitMisleading shortcutContext to confirm
Daily operationsComparable weekdays or rolling multi-week periodsOne universal inactivity thresholdHolidays, operating days, team schedule
Monthly reportingCompleted monthly cyclesSeven-day recencyReporting deadline, fiscal calendar
Quarterly planningComparable quarterly milestonesWeekly active daysPlanning window and responsible roles
Annual complianceEligible annual cycleThirty-day inactivityFiling period, jurisdiction, completed submission
One-time configurationSetup completion and continued downstream useExpecting setup pages to recurWhether configuration succeeded
Event-driven workQualifying events with appropriate responseExpecting regular calendar activityWhether relevant events occurred
Automated outputOutput success and exception handlingUI event volume aloneIntegration health, scheduled jobs, human review cadence

A seasonal pattern is a recurring pattern with a fixed and known period.4 Not every decline is seasonal, and not every recurring workflow follows a calendar. Document the expected pattern rather than using “seasonality” as a generic explanation.

An account cannot be expected to use a workflow when:

  • its plan does not include it;
  • the relevant role lacks access;
  • setup is incomplete;
  • no qualifying business event occurred;
  • the workflow already completed successfully;
  • automation now performs the task;
  • the measurement period does not contain the expected cycle.

For a more detailed distinction, see underused features versus low-frequency workflows.

Lifecycle and account context

The same behavior can mean different things at different stages.

Lifecycle context for interpreting account usage.
Lifecycle or contextPattern that may be normalQuestion before assigning risk
OnboardingNarrow breadth and activity concentrated in setup rolesIs the account progressing through the expected milestones?
ActivationUneven activity while first-value workflows are establishedDid eligible users reach the defined activation state?
Mature recurring useStable recurrence and established workflow coverageWhich previously stable component changed?
ExpansionNew users or product areas appear graduallyIs the new workflow relevant and properly enabled?
Implementation pauseReduced activity during a planned dependency or migrationIs the pause documented and still within its expected window?
Seasonal usePredictable peaks and gapsDoes the current period align with the historical seasonal cycle?
Planned offboardingIntentionally declining activityIs the account already scheduled to leave or migrate?
Account restructuringRole participation and identity may change abruptlyDid teams, permissions, or ownership change?
Product migrationUsage shifts between old and new workflowsIs the apparent loss actually migration progress?

Cohorts group entities that share a defined characteristic and make it possible to observe behavior over comparable periods.1 In B2B account analysis, useful cohort characteristics include lifecycle stage, plan, account size, use case, integration status, and expected cadence.

A new account with narrow breadth may be normal. A mature account losing previously adopted areas may be more concerning. The difference is not the raw number of areas; it is the relationship between the behavior and the account’s expected stage.

A practical signal matrix

Use a matrix like this to keep each signal, alternative explanation, and next investigation visible.

Product-usage signals, alternative explanations, and next investigations.
SignalPossible interpretationAlternative explanationEvidence to inspectPossible next action
Active users down, total activity stableParticipation is concentrating in fewer peopleTeam size changed, a specialist now owns the workflow, or automation reduced manual rolesUser contribution distribution, roles, permissions, recent VisitsConfirm expected role coverage and identify whether backup users are needed
Total activity down, product breadth stableExisting workflows remain present but occur less oftenFewer legitimate opportunities, shorter period, holiday, or improved efficiencyActivity by workflow and eligible interval, output count, historical cadenceConfirm opportunity and compare equivalent periods
Breadth down, primary champion inactivePreviously adopted workflows may have lost ownershipProduct migration, role reassignment, changed use case, or tracking lossMissing product areas, contributing users, identity quality, account notesReview workflow ownership without assuming the champion left
High page visits, low workflow completionUsers may be encountering product or setup frictionExploration, interrupted sessions, incorrectly defined completion, or repeated reference useStart and completion events, errors, selected Visits, support contextInspect several affected sessions and validate instrumentation
Account below peers but improvingOnboarding or recovery may be progressing normallyPeer group may be inappropriate or too broadLifecycle-matched peers, own-history trend, milestonesContinue monitoring against stage-specific expectations
Account above peers but decliningA previously strong account may be losing momentumOne temporary event, seasonal high baseline, or data changeMulti-period trend, product-area and user decompositionReview the components driving the decline
No UI activity, automated output stableValue may have moved to an integration or APIFailed tracking, unattended jobs, or hidden operational riskIntegration telemetry, output success, exception handling, human review VisitsReclassify the UI decline only after checking automated value delivery
One low-frequency workflow absent from a short periodThe workflow may not yet be dueWorkflow abandoned, moved, or blockedExpected cycle, last successful completion, opportunity countExtend the comparison to complete workflow cycles

The matrix should produce a specific question, not a deterministic diagnosis.

Worked B2B example: six fictional accounts

Unless noted otherwise, the example compares a current 30-day period with the immediately preceding 30-day period. Cadence-specific accounts use a complete relevant cycle.

Operating context and measured changes

Illustration only

Current-versus-previous usage signals for six fictional B2B SaaS accounts.
AccountLifecycle and expected cadenceMeaningful activity, previous → currentAdopted product areas, previous → currentActive users, previous → currentTop-user concentration, previous → currentRelevant illustrative peer comparison
Atlas LabsMature; daily collaboration1,180 → 1,040 (−11.9%)5 → 513 → 1217% → 18% (+1 percentage point)Near the center of its matched mature-account peer set
Northstar WorksMature; daily and weekly operations825 → 810 (−1.8%)4 → 46 → 234% → 76% (+42 percentage points)Total activity remains typical, but role participation is much narrower
Beacon SystemsMature; weekly Reporting and Collaboration620 → 260 (−58.1%)3 → 17 → 338% → 61% (+23 percentage points)Breadth and participation are below its matched peers and declining
Meridian GroupMature; automated daily output with monthly human reviewHuman UI activity 390 → 42 (−89.2%); automated outputs 30 → 31 (+3.3%)Human UI areas 4 → 2Human UI users 5 → 2Human activity 46% → 52% (+6 percentage points)UI usage is low but resembles integration-enabled peers
Harbor AnalyticsMature; monthly Reporting91 → 96 per complete monthly cycle (+5.5%)2 → 24 → 431% → 29% (−2 percentage points)Appears inactive in a seven-day view but normal among monthly-cadence accounts
Summit OperationsOnboarding; setup and import expected during the periodCompleted core workflows 44 → 18 (−59.1%); page views 640 → 780 (+21.9%)3 → 35 → 530% → 33% (+3 percentage points)Page reach is high, while completion trails similar illustrative onboarding accounts

Evidence, interpretation, and next question

Illustration only

Evidence, interpretations, review priorities, and next questions for six fictional accounts.
AccountSelected evidenceInterpretationReview priorityNext question
Atlas LabsThe decline falls on two days covered by a documented company closure; returning Visits show normal successful collaboration workTemporary activity decline with stable breadth, users, and distributionNo unusual usage signal after contextDoes normal recurrence resume in the next comparable period?
Northstar WorksOne administrator performs 616 of 810 meaningful actions; the second active user mostly views; four previously contributing users have no current qualifying activityStable totals hide rising concentration and reduced role coverageNeeds reviewIs the narrower participation expected, and is backup workflow ownership adequate?
Beacon SystemsDashboard use continues, but Reporting and Collaboration disappear; a previously central Reporting user has no current qualifying activityA genuine adoption contraction is plausible and worth contextual reviewNeeds reviewDid these workflows move, become irrelevant, or lose an eligible owner?
Meridian GroupRecent Visits are short validation checks; external integration telemetry shows 31 successful automated outputs versus 30 previouslyInterface activity fell because the workflow moved to automation; value delivery appears stableNo unusual usage signal after substitution checkAre automation failures and human review responsibilities still covered?
Harbor AnalyticsA generic rule sees 19 inactive days; the account completed its report on the first business day of the expected monthly cycleFalse positive caused by the wrong observation windowNo unusual usage signal after cadence correctionHas any expected monthly cycle actually been missed?
Summit OperationsInstrumented workflow evidence shows 14 starts and 3 completions; selected Visits follow Settings → Permissions → Import → exit and show a permission errorVisible evidence of a product, setup, or permission barrier deserves prompt investigationUrgent product or account investigationWhich permission or implementation dependency is preventing completion?

Atlas Labs: a decline that disappears after context

Atlas Labs initially looks like an account engagement decline because meaningful activity falls by 11.9%.

The other components remain stable:

  • all five product areas are retained;
  • active users fall only from 13 to 12;
  • concentration changes by one percentage point;
  • selected Visits after the closure show normal completed work.

The decline is explained by a temporary, documented operating interruption. Atlas may need no intervention. The useful action is to confirm that activity returns during the next comparable period.

Northstar Works: stable totals with concentration risk

Northstar’s total meaningful activity changes by only −1.8%. A volume-only rule would describe the account as stable.

The user distribution tells a different story:

  • active users fall from six to two;
  • the most active user’s share rises from 34% to 76%;
  • one administrator produces 616 of 810 meaningful actions;
  • the remaining active user contributes mostly view activity.

This is not proof that the account will churn or that four users left their jobs. It is evidence that account usage has become more dependent on one person. Northstar deserves a role-coverage and backup-champion review.

Beacon Systems: adoption contraction across several signals

Beacon loses Reporting and Collaboration, retains only Dashboard, and reduces its active users from seven to three.

Its retained-area rate is:

Beacon retained-area rate

(1 retained area ÷ 3 previously used areas) × 100 = 33.3%

The contraction appears in several independent components:

  • meaningful activity falls 58.1%;
  • breadth falls by two product areas;
  • active users fall by four;
  • concentration rises by 23 percentage points;
  • a previously central Reporting user has no current qualifying activity.

Beacon is the strongest example of a genuine product-adoption contraction worth reviewing. The next step is still investigation: confirm whether the workflows moved, became irrelevant, lost an owner, or are blocked.

Meridian Group: interface decline caused by substitution

Meridian’s human interface activity falls by 89.2%, which would trigger many customer success product usage alerts.

The account’s workflow changed:

  • an integration now produces the daily output;
  • successful automated outputs rise from 30 to 31;
  • human Visits are short monthly validation checks;
  • no expected output cycle is missed.

Meridian may be receiving equal or greater value with fewer UI actions. The correct investigation checks integration reliability, exception handling, and human review coverage—not generic re-engagement.

This example also shows why product analytics may need context from other systems. Do not imply that every automation or output signal is automatically available inside Hymetry.

Harbor Analytics: a false positive caused by the wrong window

Harbor is a monthly Reporting account. A seven-day inactivity rule flags it after 19 days without interface activity.

The account completed the expected monthly report on schedule, retained both product areas, kept four active users, and slightly reduced concentration.

Harbor is not late. The rule is wrong.

The appropriate unit is the reporting cycle, not days since any login. A risk signal should appear only when an eligible monthly cycle is missed or meaningfully changes.

Summit Operations: activity without successful progress

Summit has more page views than in the previous period, but fewer completed core workflows.

The combination matters:

  • page views rise 21.9%;
  • completed workflows fall 59.1%;
  • 14 starts produce only 3 completions;
  • selected Visits repeatedly move through Settings, Permissions, and Import;
  • a visible permission error appears before exit.

High activity does not prove healthy adoption. In this example, it may represent effort without progress. Summit deserves urgent product or account investigation focused on setup and permissions, not a churn prediction or generic engagement email.

Comparison of six fictional B2B SaaS accounts showing different product-usage signals and review outcomes.
Similar activity totals can hide concentration, contraction, substitution, cadence, or friction.

A transparent account-risk review framework

Prefer a reproducible investigation process over one opaque score.

1. Define expected account behavior

Document the workflows, roles, outputs, and recurrence that represent value for this account type.

Avoid starting with available event counts. Start with the customer’s intended use case.

2. Define eligibility and opportunity

Determine which workflows, users, roles, and product areas are actually eligible.

Record whether a realistic opportunity occurred in the observation period.

3. Compare current and previous periods

Use equal-length periods or complete cadence-specific cycles. Check holidays, fiscal calendars, release dates, and instrumentation changes.

4. Measure adoption breadth and recurrence

Show which eligible product areas are adopted, which previously adopted areas remain, and whether recurring workflows occur when expected.

5. Inspect active-user and role distribution

Measure distinct active users and the participation of relevant roles. Distinguish broad use from totals produced by one or two people.

6. Calculate concentration

Calculate top-user concentration and its percentage-point change. Keep the numerator, denominator, and contributing user visible.

7. Compare with relevant peers

Use lifecycle-, plan-, use-case-, size-, and cadence-matched peers where the sample is sufficiently meaningful. Treat the peer median as context, not a required target.

8. Check automated and alternative workflows

Look for APIs, integrations, scheduled outputs, product migrations, delegated roles, and external processes that may explain disappearing interface activity.

9. Inspect selected Visits

Choose Visits connected to the signal rather than watching recordings at random. Review sessions around the change, incomplete workflow, affected user, or missing product area.

See how to choose session replays worth reviewing for a deeper review process.

10. Add customer, support, and commercial context

Bring in known implementation plans, customer conversations, unresolved issues, renewal context, support escalations, and organizational changes.

Keep these separate from the behavioral evidence.

11. Assign a review priority with explicit reasons

Use operational labels such as:

Illustrative labels, not universal thresholds

Illustrative account-review priority labels.
PriorityIntended meaning
No unusual usage signalNo meaningful unexplained product-usage change remains after context is added
WatchOne weak, temporary, or mixed signal should be remeasured
Needs reviewSeveral aligned signals or one material unexplained change deserves contextual investigation
Urgent product or account investigationEvidence shows a substantial workflow block, severe contraction, or other issue requiring prompt human review

These are illustrative labels, not universal thresholds.

A priority record should preserve:

  • the signal;
  • current and previous values;
  • comparison basis;
  • lifecycle and cadence;
  • eligibility and opportunity checks;
  • alternative explanations considered;
  • source users, pages, or Visits;
  • the owner;
  • the next question or action;
  • the next measurement date.

For example:

That is more useful than a red badge without an explanation.

12. Record the next investigation or action

Possible outcomes include:

  • inspect permissions or setup;
  • investigate a lost workflow;
  • identify backup users;
  • compare selected Visits;
  • confirm expected cadence;
  • review similar accounts;
  • contact the account with a specific question;
  • resolve observed product friction;
  • clarify value or training;
  • update the account plan;
  • decide that no intervention is needed.

13. Remeasure using the same definitions

Use the same workflow definitions, periods, identity rules, and denominator logic.

If definitions change, version them and preserve historical comparability. Otherwise, apparent movement may come from the measurement system rather than the customer.

When a model is genuinely predictive

Teams asking how to identify churn risk from product analytics should distinguish a transparent review framework from a genuinely predictive model.

A transparent review framework is not automatically a churn prediction model.

A company should describe a system as predictive only after testing it against a clearly defined future outcome. At minimum, that requires:

  • Historical outcome labels: Define churn, non-renewal, contraction, or another outcome precisely.
  • A prediction horizon: Specify what the model estimates and how far into the future.
  • Temporal snapshots: Calculate features using only information available at the prediction date.
  • A temporal holdout: Evaluate on later, unseen periods rather than randomly mixing future and past observations. Time-series evaluation keeps training observations earlier than test observations.5, 9
  • Leakage prevention: Exclude information that would not exist at prediction time. Data leakage produces overly optimistic performance estimates.6
  • Calibration: Check whether accounts assigned a particular probability experience the outcome at a corresponding observed rate.7
  • Precision and recall: Measure both the share of flagged accounts that experience the outcome and the share of outcome accounts the model finds. Precision–recall analysis is particularly useful when positive outcomes are uncommon.8
  • False-positive analysis: Review the operational cost of investigating accounts that do not experience the outcome.
  • Segment validation: Test performance separately across lifecycle stages, account sizes, plans, geographies, and use cases.
  • Explainability: Preserve the contributing signals so a team can understand why an account was ranked.
  • Ongoing drift monitoring: Monitor performance and input changes after deployment. NIST guidance recommends continual monitoring for drift and other unexpected behavior.10

A predictive relationship between usage and churn does not by itself show that declining usage caused churn.11

From investigation to action

The best next action depends on the reason behind the signal.

Evidence-based next steps for account-usage findings.
FindingUseful next stepAvoid
Setup or permission barrierConfirm the blocked state and resolve access or configurationSending generic engagement content
Lost workflow coverageAsk whether the workflow moved, changed, or became irrelevantAssuming the customer abandoned the product
Rising concentrationConfirm expected role ownership and identify backup coverageAssuming the most active user is leaving
Incomplete workflow patternReview several affected Visits and instrumentationTreating one unusual session as root cause
Incorrect cadenceCorrect the observation window and alert definitionContacting a healthy account based on a false positive
Automation substitutionMonitor output success and exception handlingPenalizing lower UI activity
Broad unexplained contractionCombine product, relationship, support, and commercial contextCalling the account a churn case before review
Explained temporary changeRecord the context and remeasureIntervening merely because a threshold fired

When customer contact is appropriate, use the evidence to ask a specific, neutral question.

The first statement opens an investigation. The second overstates what product data can know and may undermine trust.

Common mistakes when identifying at-risk accounts

1. Using login count as the primary signal

A login proves access. It does not prove meaningful adoption, successful work, broad participation, or continued value.

2. Applying one inactivity threshold to every account

Daily, monthly, quarterly, annual, one-time, event-driven, and automated workflows require different observation rules.

3. Ignoring expected cadence

A short comparison window can flag a healthy low-frequency workflow before its next cycle is due.

4. Treating every usage decline as risk

Usage can decline because work completed, an account became more efficient, a holiday occurred, or activity moved to another path.

5. Ignoring automation or feature substitution

A steep UI decline may coexist with stable automated outputs.

6. Comparing onboarding and mature accounts

Narrow breadth may be normal during onboarding and concerning after a mature account loses established workflows.

7. Letting one champion hide falling participation

Stable totals can conceal a large decline in active users and rising dependence on one person.

8. Treating the peer median as a required target

Peers provide context. Specialized accounts can receive value with behavior below a broad median.

9. Combining everything into an opaque score

A final number without its components does not tell the team whether to investigate cadence, breadth, concentration, friction, or data quality.

10. Treating missing data as poor health

Unknown eligibility, broken identity, incomplete instrumentation, or missing account attributes should produce a data warning—not a zero score.

11. Inferring dissatisfaction or employee departure

A behavioral change does not reveal a person’s motive, employment status, or sentiment.

12. Claiming churn prediction without validation

A heuristic, alert, or weighted score is not predictive merely because it uses historical usage.

13. Triggering automated outreach from one signal

One threshold can create false positives and irrelevant customer contact. Require contextual review or carefully designed multi-signal guardrails.

14. Changing definitions without preserving comparability

If meaningful activity, product areas, identity rules, or periods change, version the definition so historical movement remains interpretable.

15. Ignoring data-quality problems

Tracking releases, missing company identity, duplicate users, test traffic, bots, API users, and event-schema changes can all imitate account risk.

How Hymetry connects account changes to their underlying evidence

Hymetry is account-centric product intelligence for B2B SaaS. It connects product usage across Companies, Users, Pages, and Visits so teams can investigate account changes without treating one signal as a verdict.13, 14, 15, 16

A practical investigation path is:

Investigation path

Account change → Product-area difference → Contributing or missing users → Relevant Visits

Start with Companies

Companies provides the account-level starting point. A team can review current usage, previous-period movement, active users, adoption breadth, product areas, and account context before deciding whether a change deserves attention.13

The goal is not to make a badge self-explanatory. The goal is to identify the specific component that moved.

Open the product-area difference

Pages organizes raw product paths into grouped pages and product areas.15

If an account loses breadth, the next question is which product areas or grouped pages disappeared. Reporting and Collaboration disappearing together creates a different investigation than a modest decline spread across every area.

Find the contributing or missing users

Users shows the people behind the account pattern.14

A team can inspect whether:

  • fewer people participate;
  • one user contributes most of the observed engagement;
  • a user the team expects to own a workflow has no observed activity;
  • several previously active users changed behavior;
  • another user replaced a previously central contributor.

The evidence should describe behavior without inferring intent.

Review relevant Visits

Visits is the session-level evidence layer.16

Rather than watching recordings at random, teams can start from the affected account, user, grouped page, or workflow and inspect Visits connected to the change. A selected Visit may show whether the captured session reached setup completion, repeatedly returned to permissions, or ended after an interruption.

Add account attributes and filters

Teams can use configured company attributes and filters to apply relevant context such as lifecycle, plan, size, region, use case, onboarding stage, or integration status. Teams decide which attributes are appropriate; Hymetry does not automatically select a comparable peer group.

Team-applied context helps avoid comparing a monthly, integration-led account with a daily, human-operated workflow simply because both are customers.

For a customer-success perspective, see Hymetry for customer success.17

Hymetry can organize behavioral evidence and shorten the path from a signal to an investigation. It cannot independently determine commercial intent, prove dissatisfaction, explain every behavioral change, or guarantee a churn outcome.

Frequently asked questions

What is an at-risk account in B2B SaaS?

An at-risk account is a customer account showing a meaningful product-usage change, adoption gap, workflow problem, or dependency that may threaten continued value and therefore deserves contextual review. It is not proof that the account will churn.

Which product usage churn signals are most useful?

Useful signals include meaningful-activity change, lost adoption breadth, lower recurrence, longer-than-expected inactivity, falling active-user participation, rising top-user concentration, disappearing role coverage, repeated incomplete workflows, and confirmed setup barriers.

The most useful combination depends on the product’s value model, lifecycle, eligibility, and cadence.

How many inactive days should trigger a customer-risk alert?

There is no universal number.

The threshold should reflect the workflow’s expected cadence and realistic opportunity. Seven inactive days may be material for daily operations and completely normal for monthly Reporting. Compare complete relevant cycles whenever possible.

Can product analytics predict customer churn?

Product analytics can contribute features to a churn model, but product-usage signals alone do not become predictive without historical outcome labels, temporal validation, leakage prevention, calibration, precision and recall analysis, segment testing, and ongoing monitoring.

Even a validated model estimates probability rather than certainty or cause.

Is high top-user concentration always risky?

No. Some products are intentionally operated by one administrator or specialist.

Concentration deserves review when it rises unexpectedly, conflicts with expected role coverage, or leaves a multi-user account dependent on one person. Interpret it alongside account size, roles, permissions, and use case.

Should a customer success product usage alert contact the account automatically?

Not by default.

A single signal can have many explanations. Use the alert to prioritize investigation, add account context, and contact the customer only when the team has a specific, relevant question or action.

How often should product-usage risk be recalculated?

Use a frequency appropriate to the workflow. Daily products may support frequent review; monthly or quarterly products need complete cycles. Preserve the same definitions and compare equivalent periods.

How does Hymetry help identify at-risk accounts?

Hymetry connects account-level changes in Companies to product areas and grouped pages, contributing or missing Users, current-versus-previous periods, configured company attributes and team-applied filters, and relevant Visits. It helps teams organize evidence for investigation but does not independently prove churn or commercial intent.

Sources

The sources below support the measurement concepts, validation cautions, and current product surfaces described in this guide. Vendor material is used carefully: Gainsight’s customer-health methodology in source 12 describes common practice, and the Hymetry sources describe current product surfaces; none independently validates a predictive relationship between product usage and churn. The fictional examples, calculations, interpretations, and visual frameworks are original to this guide.

  1. Google Analytics, “[GA4] Cohort exploration.”
    https://support.google.com/analytics/answer/9670133?hl=en
  2. Google Analytics, “[GA4] Funnel exploration.”
    https://support.google.com/analytics/answer/9327974?hl=en
  3. Kerry Rodden, Hilary Hutchinson, and Xin Fu, Google Research, “Measuring the User Experience on a Large Scale: User-Centered Metrics for Web Applications.”
    https://research.google/pubs/measuring-the-user-experience-on-a-large-scale-user-centered-metrics-for-web-applications/
  4. Rob J Hyndman and George Athanasopoulos, “Forecasting: Principles and Practice (3rd ed) — 2.3 Time series patterns.”
    https://otexts.com/fpp3/tspatterns.html
  5. Rob J Hyndman and George Athanasopoulos, “Forecasting: Principles and Practice (3rd ed) — 5.10 Time series cross-validation.”
    https://otexts.com/fpp3/tscv.html
  6. scikit-learn, “Common pitfalls and recommended practices.”
    https://scikit-learn.org/stable/common_pitfalls.html
  7. scikit-learn, “Probability calibration.”
    https://scikit-learn.org/stable/modules/calibration.html
  8. scikit-learn, “Precision-Recall.”
    https://scikit-learn.org/stable/auto_examples/model_selection/plot_precision_recall.html
  9. scikit-learn, “TimeSeriesSplit.”
    https://scikit-learn.org/stable/modules/generated/sklearn.model_selection.TimeSeriesSplit.html
  10. National Institute of Standards and Technology, AI Resource Center, “NIST AI RMF Playbook — Manage.”
    https://airc.nist.gov/airmf-resources/playbook/manage/
  11. Penn State STAT 200, “12.5 Cautions.”
    https://online.stat.psu.edu/stat200/lesson/12/12.5
  12. Gainsight, “Customer Health Score Explained: Metrics, Models & Tools.”
    https://www.gainsight.com/blog/customer-health-scores/
  13. Hymetry, “Companies: Account Intelligence.”
    https://www.hymetry.com/product/companies/
  14. Hymetry, “User Intelligence for B2B SaaS.”
    https://www.hymetry.com/product/users/
  15. Hymetry, “Pages Analytics.”
    https://www.hymetry.com/product/pages/
  16. Hymetry, “Session Visits & Replay.”
    https://www.hymetry.com/product/visits/
  17. Hymetry, “Customer Success.”
    https://www.hymetry.com/use-cases/customer-success/

About Hymetry

Hymetry is account-centric product intelligence for B2B SaaS. It helps teams understand how customer companies and the users inside them adopt and use their product.