Menu
Account and user health

Active, Light, Passive, Dropped, and At-Risk Users: Practical Definitions

Learn how to define active, light, passive, dropped, and at-risk users using product cadence, meaningful activity, recency, trend, and account context.

An active user is not simply someone who logged in. In B2B SaaS, a practical user status compares qualifying behavior with the cadence, role, permissions, lifecycle stage, and previous behavior that make sense for that person. Active, Light, Passive, and Dropped describe current engagement. At risk is better treated as a separate change or fragility signal.

That distinction matters because a user can be Active + Declining, while a monthly executive viewer can be Passive + Stable and behaving exactly as expected. There are no universal event counts or recency windows. Use meaningful actions, active days, Visits, recency, relevant product-area breadth, workflow completion, and trend—but retain the component evidence and review the company context before interpreting a label as dissatisfaction or churn.

Why a single activity threshold fails

A rule such as “three logins in 30 days means active” looks objective because it produces a clean answer. It is usually answering the wrong question.

A login shows access. It does not show that the person reached a useful workflow, completed an important task, reviewed an output, configured something correctly, or received value. The same problem applies to raw event counts and days since last activity when they are separated from role and cadence.

This is one reason a B2B product analytics framework needs company, workflow, and user context instead of only a global user count. It is also why logins should be treated as a customer-health signal rather than proof of health.

Consider how expected use varies:

How expected use varies across products and workflows
Product or workflowA healthy pattern might beWhy a universal 30-day rule misleads
Daily operationsQualifying activity on most working daysA week without role-relevant activity may matter before the month ends
Monthly reportingOne concentrated Visit around month-endLow weekly frequency may be completely normal
Quarterly planningSeveral deep Visits during a planning cycleTwo quiet months may be expected rather than evidence of disengagement
Administrator configurationActivity during setup, policy changes, or user provisioningSuccessful configuration can reduce later administrator activity
Executive dashboardPeriodic consumption of trusted outputsViewing may be the intended outcome even without creation events
Automated workflowHuman setup followed by reliable automated executionFewer manual actions may indicate success rather than failure
New-user onboardingIncreasing exploration and first workflow completionMature-user thresholds can classify a healthy learner too early
Permission-limited roleUse of a narrow set of available areasPenalizing inaccessible capabilities produces a false negative

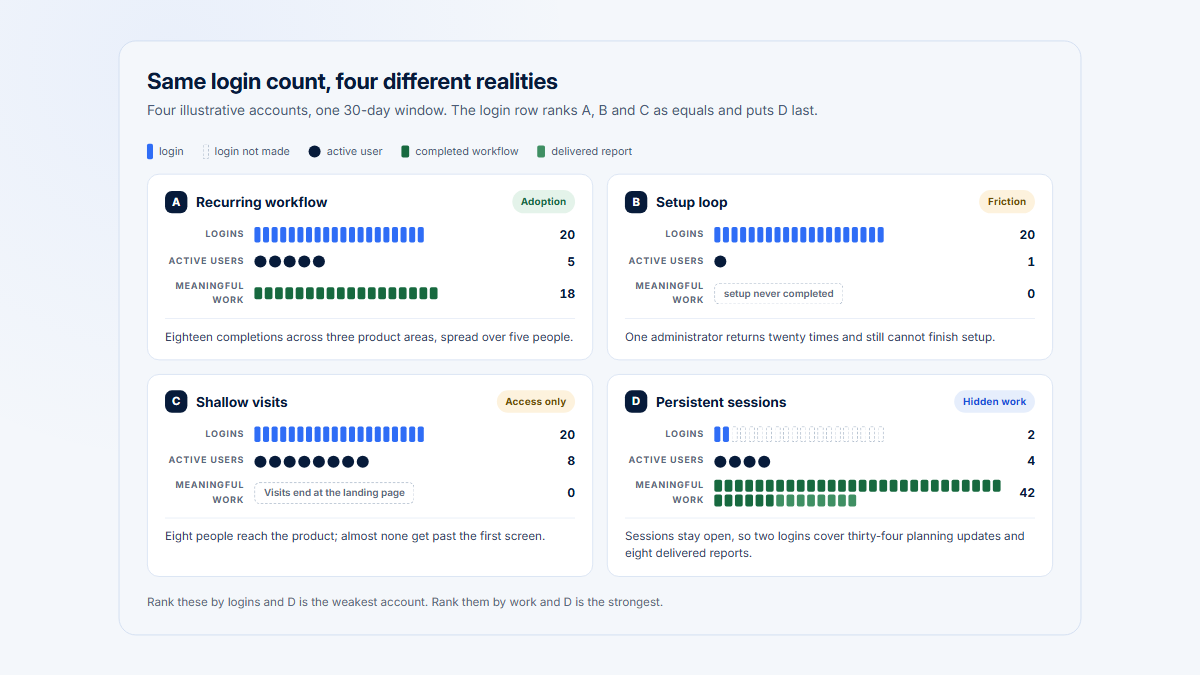
The same number of Visits can also tell very different stories.

Four Visits in a month could represent:

  • healthy monthly reporting;
  • shallow exploration without completing a first task;
  • repeated attempts to overcome friction;
  • deep specialist use concentrated into a few long workflows;
  • a decline from the user’s previous twelve Visits per month;
  • expected specialization by a viewer, approver, administrator, or executive.

The count is not useless. It is incomplete.

Google’s HEART framework offers a useful general principle: begin with the product or user goal, identify behavioral signals connected to that goal, and only then select metrics. Product-analytics guidance from Mixpanel makes a similar distinction between access and value-producing activity, while also emphasizing that the appropriate usage interval depends on the product.

Even the term “active user” is implementation-specific. Google Analytics uses its own collection and engagement conditions for the metric. Another analytics system may count every identified user with a valid Visit. A product team may reserve the label Active for users meeting a stricter, role-aware engagement rule.

Document the difference between:

  • an inclusion metric, such as “users with at least one valid Visit in the period”; and
  • an engagement status, such as “users whose qualifying behavior matches their expected role and cadence.”

Without that distinction, two dashboards can use the same phrase while measuring different things.

Practical definitions of Active, Light, Passive, and Dropped users

These definitions are starting points. Each team still needs to operationalize qualifying actions, periods, cadence, role groups, and exceptions.

Practical current-engagement definitions
Current statePractical definitionWhat it does not automatically mean
ActiveQualifying activity is consistent with expected role and workflow use during the selected periodSatisfied, retained, or not at risk
LightSome meaningful activity exists, but frequency, breadth, or depth is below the Active ruleUnhealthy or disengaged
PassiveThe user appears in the product but shows little qualifying interaction or workflow progressFailed adoption or no value
DroppedA previously engaged user has no qualifying activity across a role-appropriate drop window despite realistic opportunities to use the productDeleted, churned, dissatisfied, or no longer receiving value

Active user

An Active user performs qualifying product activity at a frequency and depth consistent with the expected use of their role and workflow during the selected period.

Supporting signals may include:

  • meaningful actions;
  • distinct active days;
  • recurring Visits;
  • use of relevant product areas;
  • recent role-appropriate activity;
  • workflow completion;
  • repeated behavior across several periods.

A user should not be classified as Active merely because the person authenticated or generated a page view.

For a daily analyst, Active might require work on several days and completion of role-relevant analysis actions. For a billing administrator, one successful monthly billing review may be enough. The definition follows the workflow, not the other way around.

Active is also a description of current behavior—not a guarantee of future retention. A person can still meet the Active threshold while using fewer areas, returning less often, or completing fewer important workflows than before.

Light user

A Light user performs some meaningful activity but at a lower frequency, breadth, or depth than the Active threshold.

A Light user may be:

  • naturally occasional;
  • a viewer or approver;
  • new to the product;
  • losing momentum;
  • using one narrow workflow appropriately;
  • sharing responsibilities with another user;
  • active only during a specific business cycle.

Light does not automatically mean unhealthy. A quarterly reviewer and a daily operator should not be expected to produce the same behavior.

The Light state is most useful when its reason remains visible. “Light because only one of five relevant product areas was used” is more actionable than the label alone. “Light because the user is in week one of onboarding” requires a different interpretation from “Light after a sustained decline from broad weekly use.”

Passive user

A Passive user appears in the product but shows little or no qualifying interaction or workflow progress.

Possible evidence includes:

  • page viewing without a meaningful action;
  • short or infrequent Visits;
  • consumption-only behavior;
  • viewing outputs created by other users;
  • repeated access without completion;
  • activity limited to landing pages or navigation;
  • stable page views while role-relevant completions disappear.

Passive use may still be valuable. Some dashboards, reports, alerts, review workflows, and approval experiences are intentionally consumption-oriented. An executive may need to read a trusted report, not edit it. An approver may act only when an exception appears.

For that reason, do not equate passivity with failure. Decide whether consumption itself is a qualifying outcome for the role. If it is, the same person might be Light or Active under a different operational definition.

Passive is most concerning when it conflicts with expected behavior or reflects a change from the user’s own baseline.

Dropped user

A Dropped user was previously active or meaningfully engaged but produces no qualifying activity during a defined drop window after having realistic opportunities to use the product.

The prior engagement requirement matters. A person who was invited but never started is not necessarily Dropped; that may be a non-activated or onboarding case. A person who used a weekly workflow consistently and then missed several expected cycles is a stronger Dropped candidate.

The drop window should follow expected cadence and lifecycle:

  • a daily operations user may need review after several missed working days;
  • a weekly project manager may need several missed weekly cycles;
  • a monthly billing administrator may not be Dropped until one or more expected billing windows pass;
  • a quarterly planner may require a much longer observation period.

A Dropped user is not necessarily:

  • deleted;
  • churned;
  • dissatisfied;
  • no longer employed;
  • no longer a customer member;
  • no longer receiving indirect value;
  • intentionally abandoning the product.

Absence is an observed behavior. Its cause still needs investigation.

Why At risk should be a separate overlay

At risk works better as a change or fragility signal than as one more mutually exclusive engagement state.

A user may still be Active but show evidence worth reviewing because:

  • active days are falling;
  • meaningful actions declined;
  • use across relevant product areas narrowed;
  • intervals between returns increased;
  • a previously recurring behavior stopped;
  • repeated incomplete Visits appeared;
  • role-relevant usage disappeared;
  • activity became dependent on one narrow workflow;
  • behavior is now concentrated around support or recovery attempts.

An At-Risk flag can therefore sit on top of an Active, Light, Passive, or Dropped state.

Examples:

  • Active + At risk: The user still crosses the Active threshold, but active days and workflow completion have declined for two periods.
  • Light + At risk: Some meaningful use remains, but the user has moved from broad weekly use to one narrow action.
  • Passive + At risk: Visits continue, but a previously completed workflow now stops at viewing or navigation.
  • Dropped + At risk: The user has crossed the role-appropriate drop window after previously recurring use.

“At risk” should still be qualified. It means the available evidence suggests decline, fragility, or an investigation priority. It does not mean the person intends to churn.

Separate current state from momentum

A two-axis model is more interpretable than forcing every user into one long list of mutually exclusive labels.

Axis 1: Current engagement state

  • Active
  • Light
  • Passive
  • Dropped

Axis 2: Momentum or risk direction

  • Gaining
  • Stable
  • Declining
  • Insufficient history
Matrix showing Active, Light, Passive, and Dropped user states across gaining, stable, and declining momentum.
Current engagement state and momentum answer different questions. A user can be active and declining, or passive and stable.

This produces combinations such as:

Example combinations of current state and momentum
Current stateMomentumInterpretation
ActiveDecliningCurrently active, but engagement is falling relative to previous behavior
LightGainingBelow the mature Active rule, but increasing activity or breadth
PassiveStableConsumption-oriented behavior is unchanged and may fit the role
DroppedDecliningPreviously engaged, now beyond the role-appropriate no-activity window
ActiveInsufficient historyCurrent activity looks strong, but there is not enough history to infer direction

Current state answers:

What does this user’s engagement look like in the selected period?

Momentum answers:

How is the pattern changing relative to comparable history or an expected baseline?

Keeping these questions separate prevents a common error: assuming that every Active user is healthy and every low-frequency user is deteriorating.

Signals that may support classification

A user status should summarize visible component signals, not replace them.

The most useful signals depend on the workflow. Snowplow’s tracking-design guidance recommends identifying the business events that matter and the decisions the data should support before specifying events. That principle is especially important here: instrumentation should reflect role-appropriate progress rather than whichever clicks are easiest to count.

Meaningful actions

Meaningful actions represent role-appropriate progress.

Examples might include:

  • completing or advancing a core workflow;
  • creating or publishing a useful output;
  • reviewing a required report;
  • approving an item;
  • inviting or configuring users;
  • resolving an exception;
  • exporting or sharing a completed result;
  • finishing a setup step.

Avoid treating every captured event as equally meaningful. Opening a menu, dismissing a tooltip, or repeatedly clicking a disabled control should not necessarily contribute to an Active threshold.

A meaningful action can also differ by role. Creating a report may matter for an analyst, while reviewing the same report may be the correct outcome for an executive.

Active days

Active days count distinct days containing qualifying behavior.

This can reveal whether activity is recurring or concentrated. Twenty actions on one day and twenty actions across ten days may indicate different use patterns.

Active days still need a cadence-aware interpretation. One active day can be healthy for a monthly workflow and concerning for a daily one.

Visit frequency

Visits show how often a person returns to the product. Normalize frequency when comparing periods of different lengths.

Visits per week

Visits per week =
qualifying Visits in the selected period
÷ number of days in the period
× 7

For example, six qualifying Visits across a 21-day period equal two Visits per week.

Normalization improves comparability, but the result still needs an expected cadence. Two Visits per week may be strong for a review workflow and weak for daily operations.

Use Visit for Hymetry’s user-facing session term. Do not confuse a Visit with a page visit inside the session.

Recency

Recency measures the time since the last qualifying action or Visit.

It is useful for detecting missed expected cycles, but recency alone is insufficient. Eight days since last use may be concerning for a daily operator and completely normal for a monthly executive viewer.

Where possible, express recency relative to cadence:

  • days since last qualifying activity;
  • expected days between uses;
  • number of expected cycles missed.

Product-area breadth

Breadth measures how many relevant product areas or grouped pages the user used.

Use a role-appropriate denominator. A user without administrative permission should not be penalized for not using Administration. A specialist assigned to one workflow may be healthy with narrow breadth.

Breadth can nevertheless expose change. A user who previously used Reporting, Projects, and Administration but now uses only the Dashboard may still be active while becoming more fragile.

Repeated use

Repeated use distinguishes a recurring behavior from one-time exploration.

Look for qualifying behavior across:

  • multiple Visits;
  • distinct active days;
  • several weeks or business cycles;
  • repeated workflow completions;
  • comparable periods.

A large event burst in one Visit should not automatically count as sustained engagement.

Observed engaged time

Observed engaged time can support interpretation by showing periods in which captured behavior indicates active product use.

It is not proof of value, attention, satisfaction, or productivity. Google Analytics similarly defines engagement time through observable application or page conditions; those observations do not reveal what a person thought or why the activity took time.

More time is not always better. A longer Visit may represent deep work, learning, confusion, waiting, or interruption. Treat engaged time as supporting evidence alongside actions and completion.

Workflow completion

Workflow completion is often stronger than page access because it represents progress toward an intended outcome.

Useful measures include:

  • number of completed workflows;
  • completion rate among started workflows;
  • return to complete after an interruption;
  • abandonment after a recurring step;
  • completion by role and lifecycle stage.

Completion still needs context. Some workflows are optional, and some users contribute value without reaching the terminal event themselves.

Trend

Trend compares current behavior with:

  • an immediately preceding period of equal length;
  • the same business cycle;
  • the user’s historical baseline;
  • a role-relevant cohort;
  • an onboarding expectation.

Possible components include changes in:

  • active days;
  • qualifying actions;
  • Visits;
  • recency;
  • breadth;
  • completion;
  • observed engaged time.

Equal-length previous-period comparison is transparent and easy to explain, but it may be distorted by seasonality, holidays, lifecycle changes, or partial periods. Preserve the raw current and previous values so the reader can inspect the change.

Eligibility and role context come first

Before classifying a user, establish whether the person had a realistic opportunity and reason to perform the behavior.

Relevant context includes:

  • role;
  • permissions;
  • plan access;
  • onboarding stage;
  • account lifecycle;
  • employment or membership status when known through an authoritative source;
  • relevant product areas;
  • expected workflow frequency;
  • whether the user creates value for others;
  • whether the user belongs to more than one company or workspace.

Examples:

  • A billing administrator may be healthy with one monthly Visit.
  • A daily operations user may be concerning after a week without qualifying activity.
  • A viewer may receive value without completing creation events.
  • A user without permission should not be penalized for not using an administrative capability.
  • A report creator may generate value that several passive viewers consume.
  • A user attached to several accounts should not have behavior from one account silently used to classify the person in another.

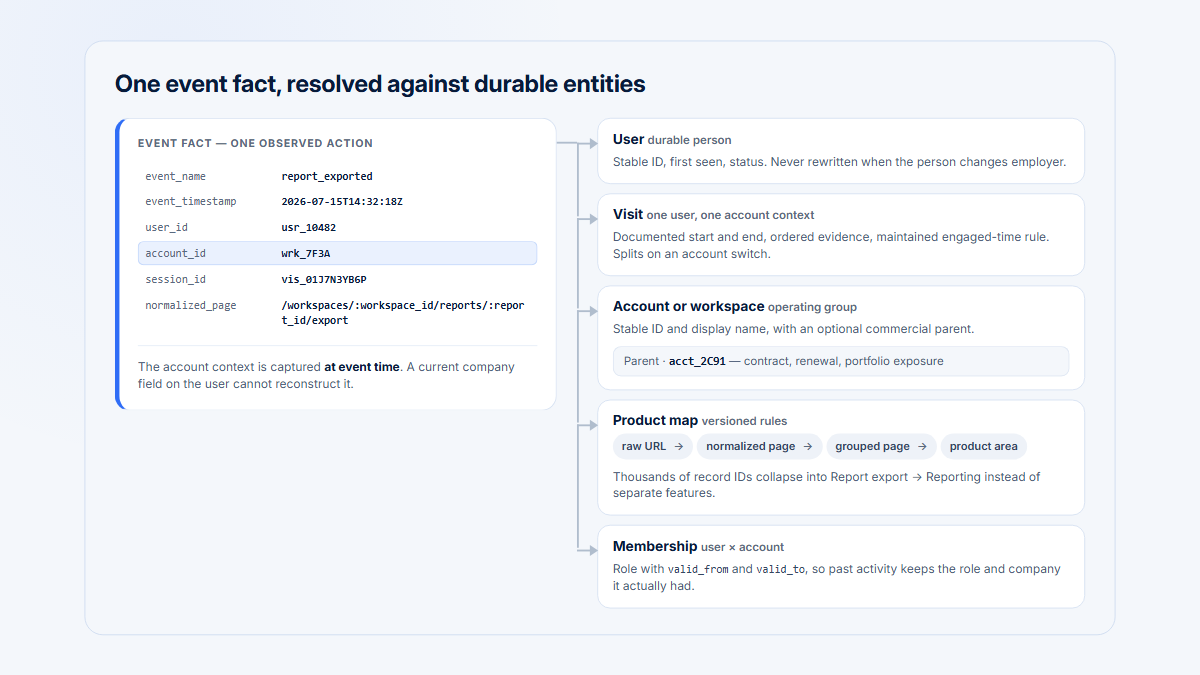
Segment’s Group specification is one example of associating users with an account, workspace, or organization. In a B2B product, the underlying model may also need multiple memberships, effective dates, role changes, and account-specific permissions.

Eligibility prevents a lack of activity from being interpreted as a behavioral decline when the opportunity did not exist.

Worked B2B example

The following data is entirely fictional and illustrative. The thresholds are examples for teaching the method, not recommended defaults or Hymetry product rules.

Assume three B2B SaaS customer accounts use a product with Dashboard, Reporting, Projects, Administration, and Automation product areas. Each role has a documented expected cadence and a set of relevant areas.

Comparison of six fictional B2B SaaS users showing role, expected cadence, current engagement state, and momentum.
The same activity volume can produce different interpretations once role, cadence, previous behavior, and workflow completion are considered.

Illustration only

Illustrative user-status comparison across three fictional B2B SaaS accounts
User and companyRoleExpected cadenceActive daysMeaningful actionsRelevant areas usedRecencyPrevious-period changeCurrent stateMomentum or riskInterpretation
Maya — Atlas LabsDaily analystMost working days18744 of 4TodayActive days unchanged; actions up 4%ActiveStableRecurring role-relevant work with broad expected use
Alex — Northstar SystemsAdministrator during rolloutWeekly, with heavier rollout activity9213 of 52 daysActions down 45%; Reporting use stoppedActiveDeclining; At-risk flagStill crosses the Active rule, but a material behavioral decline needs review
Jordan — Beacon FinanceExecutive dashboard viewerMonthly10 creation actions; 3 report views1 of 18 daysSimilar to the previous monthly cyclePassiveStableLow-frequency consumption fits the role; not automatically unhealthy
Sam — Atlas LabsNew implementation specialistAbout three times weekly during onboarding482 of 51 dayUp from 1 active day and 1 action in a partial prior periodLightGaining; insufficient mature historyBelow the mature Active rule but progressing during onboarding
Priya — CloudForgeWeekly project managerWeekly000 of 324 daysPreviously 11 active days and 36 actionsDroppedDeclining; previously ActiveNo qualifying activity across more than three expected cycles
Chris — Beacon FinanceWeekly operations contributorWeekly60 completed workflows2 of 32 daysPage views stable at 23 versus 24; completions fell from 7 to 0PassiveDeclining; At-risk flagPresence remains visible, but expected workflow progress stopped

Maya: Active + Stable

Maya’s activity matches a daily analyst workflow. She works on 18 distinct days, completes recurring meaningful actions, and uses all four relevant product areas. Her behavior is also similar to the previous period.

The Stable label does not mean her experience is perfect. It means the selected evidence does not show a material direction change.

Alex: Active + Declining

Alex still satisfies the current Active rule. Nine active days and 21 meaningful actions show continuing engagement.

The previous-period comparison changes the interpretation. Meaningful actions fell by 45%, product-area breadth narrowed, and Reporting use stopped. Alex can therefore be both Active and At risk.

A useful label explanation would be:

Active · declining because meaningful actions fell from 38 to 21
and role-relevant Reporting use stopped.

This is more informative than moving Alex into a generic At-Risk bucket and hiding the fact that substantial current use remains.

Jordan: Passive + Stable

Jordan has one active day in the monthly period and does not create or edit content. A count-only model might label the user inactive.

The role tells a different story. Jordan is expected to review an executive dashboard once per month. Three report views and a stable monthly pattern may be healthy consumption.

Under a team that defines successful report review as a qualifying action, Jordan might instead be Light or Active. The important point is not the exact label. It is that the rule reflects the role and remains documented.

Sam: Light + Gaining

Sam is new and has not accumulated enough mature history for a stable comparison. Current breadth and frequency remain below the established Active rule, so Light is a reasonable current state.

At the same time, active days, meaningful actions, and product-area use are increasing. The Gaining label captures that progress without pretending a partial prior period is a reliable baseline.

Sam should also carry an Onboarding or Insufficient-history context rather than being evaluated exactly like Maya.

Priya: Dropped after a role-appropriate window

Priya previously used the product every week. She now has no qualifying activity for 24 days, crossing more than three expected weekly cycles.

That supports a Dropped classification under this fictional rule. Had only five days passed, the same absence would not be enough. The drop window follows the role’s expected cadence.

The data still cannot explain whether Priya changed roles, went on leave, left the company, delegated the work, encountered a product problem, or intentionally stopped using the workflow.

Chris: stable page views, declining progress

Chris shows why login or page-view counts can hide disengagement. Active days and page views remain nearly unchanged, but workflow completion fell from seven to zero.

A reasonable current state is Passive because presence remains while qualifying progress disappears. Declining and At risk describe the directional signal.

The next step is investigation, not an automatic customer message. The team should inspect the affected workflow, company context, and relevant Visits.

A transparent classification process

Use a process that can be explained, tested, and revised.

  1. Define meaningful behavior by role. Identify which actions or outcomes represent progress for each role or workflow.
  2. Define expected cadence. Establish whether the behavior is expected daily, weekly, monthly, quarterly, seasonally, or only after a trigger.
  3. Define the selected period. Use a period that can capture the expected behavior and support a fair comparison.
  4. Calculate current-state signals. Measure qualifying actions, active days, Visits, recency, breadth, completion, and other relevant components.
  5. Compare with previous behavior. Use an equal-length previous period, historical baseline, business cycle, or appropriate cohort.
  6. Assign the current state. Select Active, Light, Passive, or Dropped using documented, role-aware rules.
  7. Add a momentum or risk overlay. Assign Gaining, Stable, Declining, or Insufficient history, plus an At-Risk flag when the evidence merits investigation.
  8. Preserve component metrics. Store the values, denominators, period, comparison, and rule version behind the label.
  9. Review edge cases. Check new users, permission changes, leave, shared responsibilities, seasonal use, multiple accounts, and partial periods.
  10. Validate with selected Visits and customer context. Inspect representative evidence before treating the label as an operational conclusion.
  11. Recalibrate using historical data. Review whether the rules separate useful patterns without creating excessive noise.
  12. Document every rule change. Preserve comparability or explicitly mark where the definition changed.
Flow from user eligibility and expected cadence through meaningful activity to current state and a separate momentum overlay.
Define who should be measured and what meaningful use looks like before assigning a state or risk overlay.

Show the reason, not only the label

Prefer:

Active · declining because active days fell from 9 to 4
and Reporting use stopped.

Over:

At risk

The first version gives the reader something to validate. The second requires trust in an opaque classification.

At minimum, retain:

  • current state;
  • momentum;
  • At-Risk reason when applied;
  • current-period values;
  • comparison-period values;
  • expected cadence;
  • role or rule group;
  • rule version;
  • data-quality or confidence note.

Example of a role-specific rule record

The following is illustrative, not a universal recommendation:

Rule group: Administrator during rollout
Expected cadence: Weekly
Qualifying actions:
- invite or configure a user
- publish an access rule
- complete a rollout checkpoint

Active:
Qualifying behavior in at least two distinct weeks
and at least four qualifying actions in the selected period

Dropped:
No qualifying behavior across three expected weekly cycles
after previous recurring use

Declining:
At least two role-relevant components fall materially
versus an equal-length previous period

Minimum history for momentum:
Two complete comparable periods

A transparent rule like this can be challenged and improved. A single hidden score cannot.

Threshold stability and hysteresis

Thresholds create boundary problems.

Suppose the Active rule requires four qualifying actions. A user produces four actions in one period, three in the next, then four again. Without stability rules, the status alternates between Active and Light even though the underlying behavior barely changed.

This is often called status flapping. Monitoring systems solve an analogous problem by requiring a condition to persist before an alert changes state. Prometheus, for example, supports hold durations before an alert fires and before it is cleared. Product teams can borrow the principle without treating monitoring configuration as a universal product-analytics standard.

Possible approaches include:

Separate entry and exit thresholds

A user might enter Active after reaching a higher threshold but remain Active until behavior falls below a lower exit threshold.

This creates a buffer around the boundary.

Minimum duration before a change

Require the new condition to persist for a defined duration or expected cycle before changing the label.

This helps ignore one-off fluctuations but introduces delay.

Multi-period confirmation

Require decline across two comparable periods rather than reacting to one.

This may work for high-frequency products but can be too slow for quarterly workflows.

Confidence or insufficient-history state

When the evidence is weak, expose that uncertainty instead of forcing a definitive result.

Examples include:

  • insufficient history;
  • partial period;
  • low-confidence trend;
  • data gap;
  • recent role change.

Preserve the previous state until enough evidence exists

Keeping the previous state can reduce noise when the current period is incomplete or one signal barely crosses a boundary.

The interface should still disclose that the state is being retained and why.

No one stability method works for every product. Choose an approach that matches cadence, decision urgency, and the cost of false changes.

New users and insufficient history

New users should not immediately be classified as Passive or At risk simply because they have not yet accumulated mature-user behavior.

Possible lifecycle treatments include:

  • New;
  • Onboarding;
  • Insufficient history.

These can sit alongside the current engagement state rather than replacing it.

For a new user, focus on:

  • time to first meaningful use;
  • completion of role-relevant setup;
  • number of active days since invitation or activation;
  • early Visit recurrence;
  • expansion into relevant product areas;
  • progress between onboarding steps;
  • direction of activity.

A user who has not completed a mature weekly workflow after two days may be behaving normally. A user who has not reached a first meaningful outcome after several expected onboarding opportunities may need investigation.

Compare new users with:

  • the documented onboarding expectation;
  • users at the same lifecycle stage;
  • the person’s own early progression.

Do not compare them blindly with long-established power users.

Missing, automated, and invalid activity

Classification rules are only as reliable as their population and data.

Handle these cases explicitly:

Activity and identity cases that can distort user status
CaseWhy it can distort statusPossible treatment
Internal staffEmployee testing can inflate activity and breadthExclude or label internal identities and networks
Support impersonationSupport work can appear as customer activityMark impersonated Visits and exclude them from user status
Demo and test usersScripted or exploratory behavior is not customer adoptionMaintain explicit test-user rules
BotsAutomated requests can inflate page views and sessionsFilter recognized bot activity before classification
Service accountsMachine activity can make a human identity look activeClassify separately from people
IntegrationsSuccessful automation may continue while human activity fallsModel automation outcomes separately
Company changesOld account membership can misattribute behaviorUse effective dates and current membership
Leave or temporary absenceMissing activity may have a known external explanationAdd an eligibility or exclusion period when authoritative data exists
Deleted usersHistorical behavior may still matter, but current eligibility changesPreserve history while preventing misleading current-state alerts
Data gapsInstrumentation failure can resemble a sudden dropShow a data-quality warning and avoid definitive status changes

Google Analytics documents explicit filtering for internal traffic, and Snowplow documents bot-event filtering because automated activity can distort page-view and session measures. The same data-hygiene principle applies to user status.

Do not silently remove activity without an auditable rule. Preserve enough metadata to understand what was excluded and why.

Interpret user status inside company context

A user status is not an account conclusion.

Examples:

  • One Dropped user may be harmless when several trained backup users remain active.
  • One Active user may hide fragile account concentration.
  • Several Passive viewers may be expected in a reporting product.
  • A declining champion may matter more than an occasional viewer.
  • Broad company adoption can continue after one individual stops.
  • A company may remain active while an important role or workflow disappears.
  • Several Light users may collectively represent healthy distributed adoption.

This is why product usage by company should be reviewed alongside individual behavior.

Company-level questions include:

  • How many eligible users remain active?
  • Is activity distributed or concentrated?
  • Which roles are represented?
  • Which product areas are still used?
  • Did the account lose a workflow, or only one person?
  • Are backup users available?
  • Is the account onboarding, renewing, expanding, or undergoing an organizational change?

A single highly active person can conceal champion concentration risk when the rest of the account has little independent adoption.

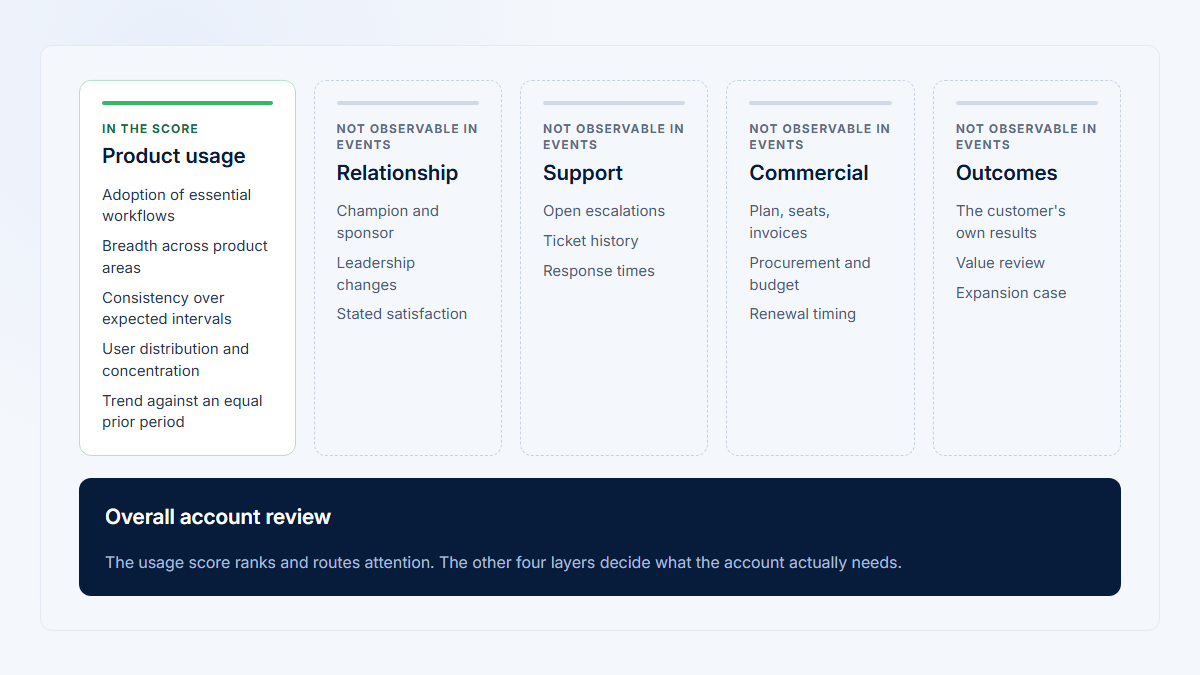
A customer health score can summarize several account signals, but it should not erase the user-level evidence. A useful investigation moves between the account pattern and the people, workflows, and Visits responsible for it.

Common mistakes

Common user-engagement status mistakes and better approaches
MistakeBetter approach
Defining Active by login countUse role-appropriate meaningful behavior and cadence
Applying one threshold to every roleDefine role or workflow groups with relevant eligibility
Applying one period to every workflowMatch the period to daily, weekly, monthly, quarterly, or event-triggered use
Treating Passive as automatically negativeDetermine whether consumption is valuable for the role
Treating Dropped as churnedDescribe observed absence and investigate its cause
Making At risk mutually exclusiveApply it as a change or fragility overlay
Ignoring previous behaviorCompare current behavior with an appropriate baseline
Classifying new users too earlyAdd New, Onboarding, or Insufficient-history context
Treating more time spent as betterUse observed engaged time as supporting evidence, not proof of value
Ignoring automated or internal trafficExplicitly filter or separately classify it
Changing thresholds without preserving comparabilityVersion the rules and retain component metrics
Hiding reasons inside an opaque scoreShow the evidence and rule behind the label
Triggering customer outreach from a status aloneReview company context and selected Visits first
Mixing behavior from several accountsClassify account-specific memberships where relevant
Penalizing inaccessible product areasUse only eligible areas in breadth calculations
Treating a partial period as a full comparisonMark incomplete periods or normalize carefully

How Hymetry connects user status to account and session evidence

Hymetry’s connected product model helps teams move from a user signal to the context and session evidence behind it.

User status → Company context → Product-area change → Relevant Visits

Start with Users

The Users area provides the individual layer: current user status language, active days, observed engaged behavior, pages or product areas used, last seen, trend, and company context.

The purpose of a label is to prioritize attention—not to hide the underlying behavior.

Review the Company

Open the related Company to see whether the pattern is isolated or part of a broader account change.

Questions include:

  • Are other users still active?
  • Is adoption broad or concentrated?
  • Did a role disappear from the active user mix?
  • Are several users declining together?
  • Does the account still use the same product areas?

This step prevents one person’s behavior from being mistaken for the complete customer story.

Inspect product areas and grouped pages

Use Pages to identify which product areas or grouped pages changed.

An Active + Declining user may still return frequently while no longer using Reporting. A Passive user may continue opening a Dashboard but stop progressing through a previously recurring workflow.

Current-versus-previous-period evidence makes that change easier to inspect without claiming to know its cause.

Open relevant Visits

In Hymetry, a Visit is the session-level evidence layer.

Relevant Visits can show:

  • the ordered pages used in a session;
  • the user and company;
  • observed timing and engaged behavior;
  • interaction context;
  • the recording when available and permitted by the project’s capture and privacy configuration.

Aggregate data identifies where a signal exists. Visits help a person investigate what was observed in selected sessions.

Hymetry does not automatically know the user’s intent, employment status, satisfaction, or probability of churn. The product connects evidence so product and customer teams can make a better-informed judgment.

For customer-facing use, review the Customer Success use case before turning a status into outreach. The status should help form a question, not dictate the conversation.

Practical takeaway

A useful product engagement status is an explainable summary of behavior—not a psychological judgment.

Define meaningful use by role. Match the observation window to expected cadence. Separate current state from momentum. Preserve the metrics and rules behind every label. Account for eligibility, onboarding, automation, and data quality. Then inspect the company and selected Visits before acting.

The goal is not to produce the most labels. It is to help a team notice meaningful changes without pretending the data says more than it does.

Frequently asked questions

What is an active user in SaaS?

An active user performs qualifying product behavior at a frequency and depth consistent with the expected use of the person’s role and workflow during the selected period. A login alone is not enough. The exact active user definition should document meaningful actions, cadence, eligibility, period, and any role-specific rules.

What is the difference between a Light and Passive user?

A Light user performs some meaningful activity but falls below the Active rule in frequency, breadth, or depth. A Passive user appears in the product but shows little qualifying interaction or workflow progress. Passive consumption may still be valuable for viewers, executives, approvers, dashboards, or reports.

When should a user be considered Dropped?

A user should be considered Dropped only after previous meaningful engagement and a role-appropriate period with no qualifying activity despite realistic opportunities to use the product. The drop window should reflect expected cadence. A daily workflow and a quarterly workflow should not use the same window.

Can an Active user also be At risk?

Yes. Active describes current engagement, while At risk describes decline or fragility. A user may still meet the Active rule while active days, meaningful actions, breadth, completion, or return frequency are falling.

How do you identify disengaged users?

Start with changes in meaningful actions, active days, Visit recurrence, recency, relevant product-area breadth, and workflow completion. Compare the current period with a suitable baseline, then review role, permissions, lifecycle, company context, data quality, and selected Visits before interpreting the cause.

Is login count ever useful?

Login count can show access and return frequency, but it cannot prove meaningful adoption or value. It is more useful as one supporting signal alongside role-relevant actions, completion, breadth, trend, and company context.

How should monthly or quarterly users be classified?

Use the business cycle as the expected cadence. Evaluate whether the person appeared and completed role-relevant behavior during the appropriate monthly or quarterly window. Do not classify the person as inactive merely because there was no activity in a shorter daily or weekly period.

Should user status and company health use the same rules?

No. User status describes individual behavior. Company health may also depend on adoption breadth, distribution across users and roles, workflow coverage, lifecycle, account concentration, and other customer context. User states can contribute evidence without determining the account conclusion by themselves.

How often should thresholds be recalibrated?

Review thresholds when product workflows, roles, instrumentation, plans, or customer behavior change. Also test them periodically against historical examples and selected Visits. Version every material rule change so previous and current classifications are not compared as though the definition stayed constant.

Sources

  1. Google Research — Measuring the User Experience on a Large Scale: User-Centered Metrics for Web Applications. https://research.google/pubs/measuring-the-user-experience-on-a-large-scale-user-centered-metrics-for-web-applications/
  2. Mixpanel Documentation — Get to Know Your Users. https://docs.mixpanel.com/guides/strategic-playbooks/guide-to-product-analytics/get-to-know-your-users
  3. Mixpanel Documentation — Analyze User Engagement. https://docs.mixpanel.com/guides/strategic-playbooks/guide-to-product-analytics/analyze-user-engagement
  4. Google Analytics Help — [GA4] Understand user metrics. https://support.google.com/analytics/answer/12253918?hl=en
  5. Google Analytics Help — User engagement. https://support.google.com/analytics/answer/11109416?hl=en
  6. Segment Documentation — Spec: Group. https://segment.com/docs/connections/spec/group/
  7. Snowplow Documentation — Introduction to tracking design. https://docs.snowplow.io/docs/fundamentals/tracking-design-best-practice/
  8. Snowplow Documentation — Filtering bot events. https://docs.snowplow.io/docs/events/filtering-bot-events/
  9. Google Analytics Help — Filter out internal traffic. https://support.google.com/analytics/answer/10104470?hl=en
  10. Prometheus Documentation — Alerting rules. https://prometheus.io/docs/prometheus/latest/configuration/alerting_rules/
  11. Hymetry — Users: User Intelligence for B2B SaaS. https://www.hymetry.com/product/users/
  12. Hymetry — Companies: Account Intelligence. https://www.hymetry.com/product/companies/
  13. Hymetry — Pages Analytics. https://www.hymetry.com/product/pages/
  14. Hymetry — Visits: Session Visits & Replay. https://www.hymetry.com/product/visits/
  15. Hymetry — Customer Success. https://www.hymetry.com/use-cases/customer-success/

About Hymetry

Hymetry is account-centric product intelligence for B2B SaaS. It helps teams understand how customer companies and the users inside them adopt and use their product.