What does a login actually prove?
A login shows that a person or process crossed an access boundary or entered an authenticated state. Depending on instrumentation, it may represent a submitted credential, an identity-provider response, a restored session, or an automatic token flow.
It does not show what happened next. One user can authenticate repeatedly without completing setup, while another can remain signed in for weeks and complete valuable work with only one recorded login.
| A login can support | A login cannot establish |
|---|---|
| First-access activation, authentication troubleshooting, access recency, security monitoring, and onboarding prerequisite completion. | Workflow completion, meaningful feature use, account adoption, user penetration, customer value, satisfaction, intent, or renewal. |
Keep the event definition explicit: interactive sign-in, silent authentication, token refresh, session restoration, and machine authentication are not interchangeable.
Why are login counts technically unstable?
| Condition | Effect on counts | Interpretation risk |
|---|---|---|
| Persistent web, mobile, or desktop sessions | Work continues without new authentication. | Valuable use is undercounted. |
| Single sign-on or silent authentication | Identity is confirmed once or without an interactive screen. | Low app-login counts can reflect good SSO; technical events can look deliberate. |
| Refresh tokens and session restoration | Access is renewed automatically. | Machine operations can be mislabeled as human logins. |
| Security reauthentication | Policy forces additional sign-ins. | Higher counts can reflect stricter policy, not adoption. |
| Tabs, redirects, callbacks, and password managers | One access sequence emits duplicate events. | Repeated technical events look like repeated engagement. |
| Shared, service, and integration identities | Several people or no person appears under one identity. | Counts do not represent users or account-wide adoption. |
| Different web, app, and SSO instrumentation | Flows emit different definitions. | Platform, user, account, and period comparisons become invalid. |
Authentication architecture can change the metric even when behavior stays constant. Track flow type, event reason, identity type, channel, and deduplication rules if the count will be used operationally.
| Contract field | Example values | Reason to retain it |
|---|---|---|
| Authentication interaction | Credential submitted, SSO callback, silent check, refresh, restored session | Separates deliberate access from technical renewal. |
| Result | Success, failure, challenge, lockout, cancel | A failed attempt is an access problem, not product activity. |
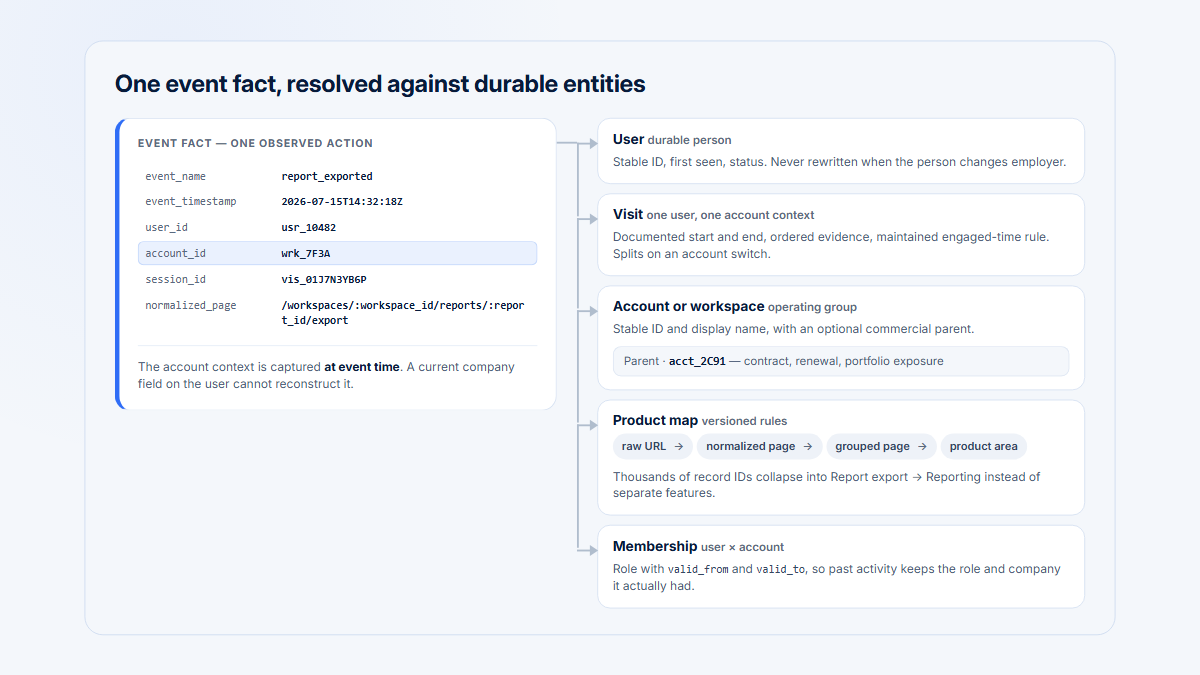
| Actor type | Customer, employee support, service, integration, bot, test | Machine and internal traffic should not become customer engagement. |
| Channel | Web, mobile, desktop, API, identity provider | Usage may move channels while one count falls. |
| Reason | New session, policy recheck, expired token, account switch | Security changes can alter frequency without behavior change. |
| Deduplication key | Flow ID or trusted authentication transaction ID | Redirect and callback chains can emit duplicates. |
Do not retroactively rename a silent refresh as a human login. If the instrumentation changes, version the definition and mark the series break so historical movement is not misread as customer movement.
What product and account context do login totals miss?
- Who: one administrator can produce every login while eligible operators remain inactive.
- What: access does not reveal the product area, action, completion, or output.
- How often value occurs: a monthly workflow should not be judged by a daily login expectation.
- Distribution: the same total can be shared across roles or concentrated in one champion.
- Channel: APIs, integrations, mobile apps, delivered reports, and downstream outputs may create value outside the primary interface.
- Outcome: observed product use rarely proves the customer's offline result or why it occurred.
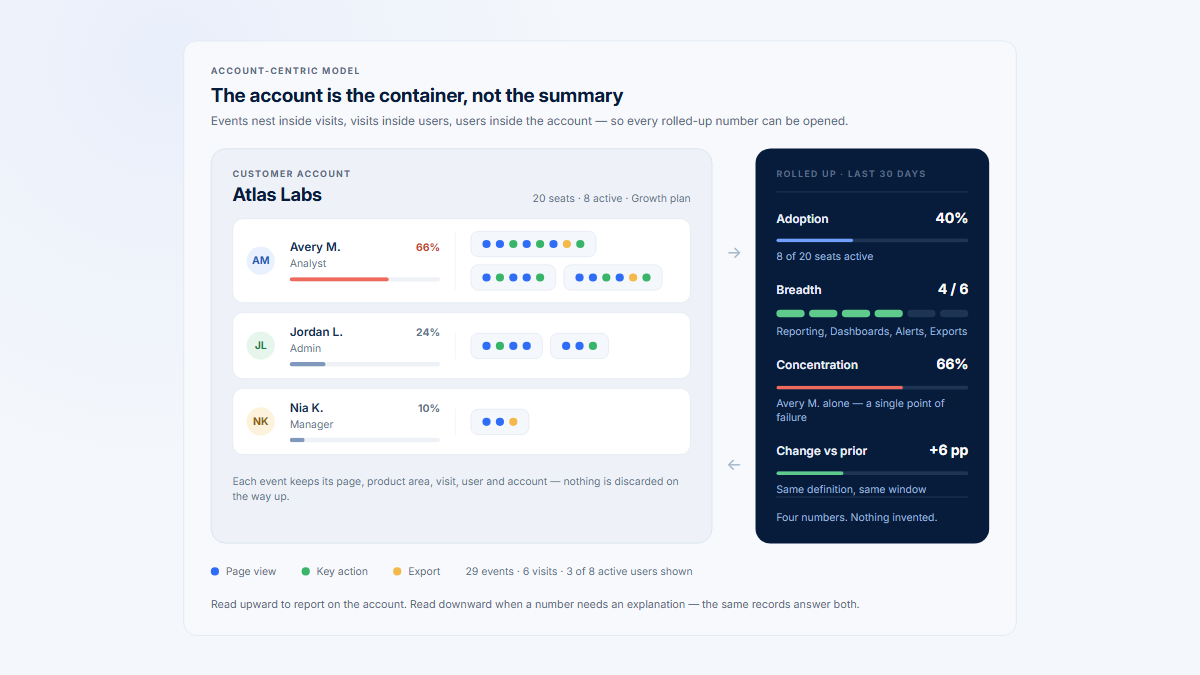
B2B health needs both account and user grain. Compare companies at similar plan, role mix, lifecycle, and cadence; avoid treating every seat or customer as equally eligible.
What does the same login count hide?
All examples below are illustrative and use a 30-day window.
Same login count, four different realities
Four illustrative accounts, one 30-day window. The login row ranks A, B and C as equals and puts D last.
Recurring workflow
AdoptionLogins
20
Active users
5
Meaningful work
18
Eighteen completions across three product areas, spread over five people.
Setup loop
FrictionLogins
20
Active users
1
Meaningful work
0
One administrator returns twenty times and still cannot finish setup.
Shallow visits
Access onlyLogins
20
Active users
8
Meaningful work
0
Eight people reach the product; almost none get past the first screen.
Persistent sessions
Hidden workLogins
2
Active users
4
Meaningful work
42
Sessions stay open, so two logins cover thirty-four planning updates and eight delivered reports.
Rank these by logins and D is the weakest account. Rank them by work and D is the strongest.
| Account | Logins / users | Other behavior | What the total hides |
|---|---|---|---|
| A: recurring workflow | 20 / 5 | 18 completions across three relevant areas | Distributed, repeated progress. |
| B: setup loop | 20 / 1 | Administrator returns repeatedly but never completes setup | Frequency may reflect friction. |
| C: shallow visits | 20 / 8 | Most Visits end at the landing page | Broad access without meaningful action. |
| D: persistent sessions | 2 / 4 | 34 planning updates and eight delivered reports | Low login count with substantial work. |
The count alone cannot tell a customer-success team which account deserves help. The additional behavior changes both the explanation and next step.
The examples also show why login-to-completion ratios require care. Account A records 18 / 20 = 90% completions per login, but the numerator is a workflow count and the denominator is an authentication count at a different grain. Account D would produce 34 / 2 = 17 updates per login because its sessions persist. Neither ratio is a stable adoption rate.
| Account | Best next question | Relevant evidence |
|---|---|---|
| A | Is the recurring workflow distributed across the intended roles? | User penetration, completion by role, concentration |
| B | Where does setup fail or repeat? | Failed steps, errors, selected Visits, support context |
| C | What prevents the first meaningful action? | Landing exits, prerequisites, permissions, onboarding research |
| D | Are persistent sessions and delivered reports expected? | Session policy, channel usage, output delivery, outcomes |
Which signals should replace login-led health?
Do not swap logins for one universal metric. Move from weak access evidence toward the strongest observable evidence the workflow supports.
From access to outcome: six levels of evidence
Each level answers a stronger question than the one below it. Logins sit on the bottom step.
Login
Access happened
Active Visit
Someone was present
Relevant interaction
A capability was touched
Meaningful action
A workflow progressed
Repeated or distributed adoption
It recurs and it spreads
Outcome evidence
The customer result appeared
Can still hidePersistence, policy, machines, and no product use at all
Can still hideShallow activity; session definitions differ
Can still hideRetries, accidental or mandatory clicks
Can still hideLater abandonment; weak link to value
Can still hideEligibility, role differences, required use
Can still hideOffline results, delay, uncertain attribution
Climb as far as the workflow allows, then keep the level visible in the report. A step-1 signal should never outweigh a step-4, 5 or 6 signal that contradicts it.
| Signal | Shows | Can still hide |
|---|---|---|
| 1. Login | Access or authentication | Persistence, policy, machines, and no product use |
| 2. Active Visit or observed activity | Presence at a defined cadence | Shallow activity and session-definition differences |
| 3. Relevant interaction | Contact with a capability | Retries, accidental or mandatory actions, and incomplete progress |
| 4. Meaningful action | Progress through a defined workflow | Later abandonment and a weak mapping to value |
| 5. Repeated or distributed adoption | Recurrence, account reach, user penetration, breadth, or concentration | Required use, eligibility, role differences, and repeated friction |
| 6. Outcome evidence | The intended customer result | Offline results, delay, external systems, and uncertain attribution |
A practical health view keeps multiple dimensions visible: meaningful workflow completion, active users and companies, adoption breadth, penetration, top-user concentration, current-versus-prior movement, session evidence, relationship and support context, and customer-reported outcomes. The customer health score guide shows how to combine dimensions without hiding them.
| Health dimension | Product evidence | Context to keep beside it |
|---|---|---|
| Workflow progress | Qualified completion, saved output, successful setup, or approval | Opportunity, role, failure states, and outcome relevance |
| Recurrence | Successful periods, active days, or repeated Visits | Expected cadence and complete-period denominator |
| Account adoption | Areas adopted, active users, penetration, and concentration | Eligibility, plan, lifecycle, and intended role mix |
| Movement | Current versus prior counts, rates, users, and areas | Equal periods, seasonality, releases, and identity changes |
| Customer outcome | When observable, an explicit result linked to the workflow | Customer confirmation and limits on causal attribution |
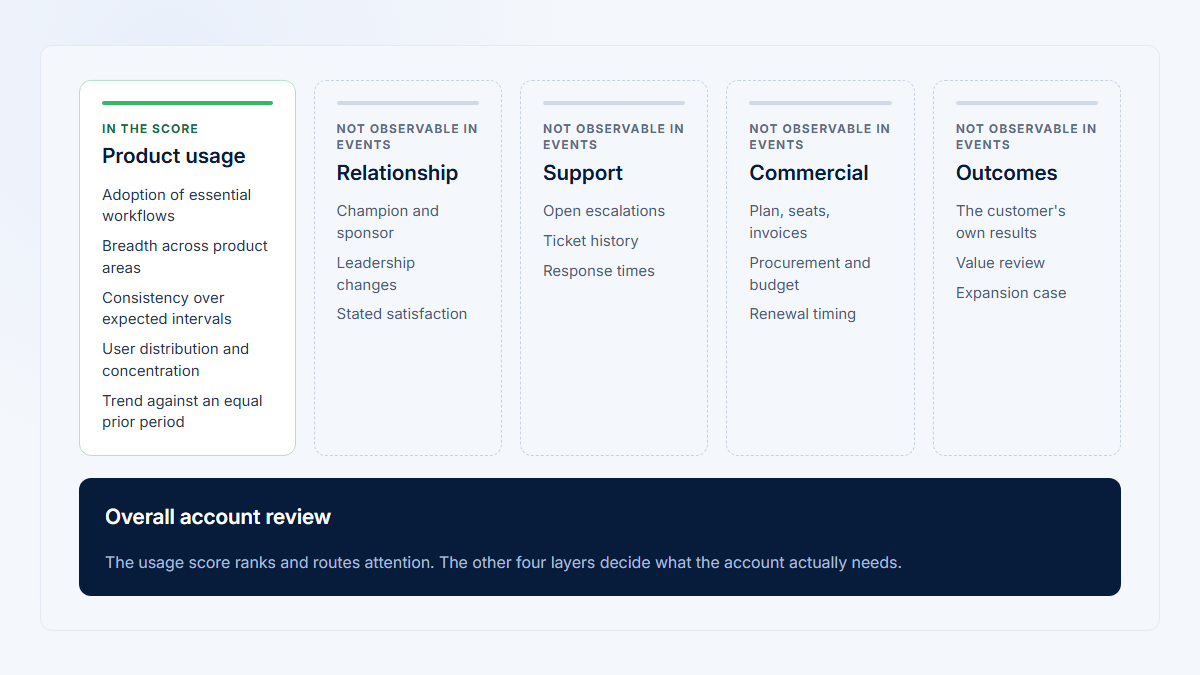
| Relationship context | Usually outside product events | Goals, feedback, support, stakeholder changes, and commercial state |
Logins can remain a supporting field in this view, especially for activation or authentication problems. They should not receive enough weight to override contradictory evidence such as falling completion, concentrated participation, or confirmed customer outcomes.
How should you investigate a login decline?
One decline, six readings
What sits beside the login line decides the explanation. Only the last row supports a risk conclusion, and only as a candidate.
Before reading
Event definition unchanged? Machines and staff split out? Equal periods? Expected cadence?The chart that started it
Logins down over eight weeks. On its own this supports none of the six readings below.
logins
actions
Sessions last longer, SSO changed, or the work moved to another channel.
Inspect: Auth changes, channel activity, delivered outputs
logins
users
Fewer people hold the same work: roles, permissions or a reorganisation.
Inspect: User trends, concentration, account notes
logins
cycle
The monthly workflow finished on time. The window, not the account, changed.
Inspect: The equivalent prior cycle, next expected date
logins
completion
Status checks and retries, not adoption. Rising logins here is a bad sign.
Inspect: Failed steps, error paths, selected Visits
logins
actions
A reauthentication policy changed. Behaviour did not.
Inspect: Method, event reason, session continuity
logins
everything
Disengagement is plausible here — alongside friction, seasonality or missing data.
Inspect: Data quality, affected workflows, customer context
Validate the data, compare equal periods, segment the accounts and roles, then look at Visits or feedback. A single falling line is where the investigation starts.
| Pattern | Plausible explanation | Inspect next |
|---|---|---|
| Logins fall; meaningful actions hold or rise | Longer sessions, SSO, another interface, integration use | Auth changes, channel activity, session boundaries, outcomes |
| Logins and active users fall; concentration rises | Role change, permissions, reorganization, or narrowed use | User trends, customer-confirmed roles, account notes |
| Logins fall after a monthly or seasonal cycle | The expected workflow completed | Equivalent cycles, outcomes, next expected date |
| Logins stay high; completion falls | Status checking, retries, failed setup, friction | Failed steps, relevant interactions, selected Visits, feedback |
| Counts shift after identity policy changes | Reauthentication changed without product-use change | Method, policy, event reason, session continuity |
| Use moves to API, app, integration, or delivered output | The main interface is no longer the only value channel | Channel events, outputs, and role context |
| Logins, users, actions, and outcomes all fall | Disengagement is possible alongside friction, seasonality, change, or missing data | Data quality, affected workflows, account context, research |
Validate collection first, compare equal periods and expected cadence, segment affected accounts and roles, then review sessions or feedback. Do not jump from one line chart to an account-risk label.
- Confirm the definition, source systems, completeness, and release or identity-policy changes.
- Split interactive successes, failures, silent flows, machines, internal staff, and channels.
- Compare active users, companies, meaningful actions, completions, outputs, breadth, and concentration.
- Locate the accounts, roles, product areas, and lifecycle stages responsible for the movement.
- Match the window to expected cadence and check equivalent prior cycles.
- Inspect selected Visits, failure paths, support records, and customer feedback before assigning an explanation.
When is login data still useful?
- First-login activation: confirms that an invited person can access the product; follow it with a meaningful milestone.
- Authentication reliability: reveals failed sign-ins, lockouts, SSO errors, and access barriers.
- Security: supports anomaly and reauthentication review when defined for that purpose.
- Supporting recency: helps orient a review when paired with meaningful behavior and cadence.
- Identity debugging: helps distinguish human, service, shared, and machine access.
| Metric | Defensible denominator or comparison | Follow-up evidence |
|---|---|---|
| Invitation-to-first-login | Eligible invited users with a delivered invitation | Time to first meaningful setup or workflow milestone |
| Authentication failure rate | Failed interactive attempts / all eligible interactive attempts | Error reason, identity provider, channel, and eventual success |
| Users with recent access | Distinct eligible people with an interactive success in the cadence window | Meaningful activity after access and persistent-session behavior |
| Locked-out accounts | Distinct eligible customer identities with a lockout | Resolution time and whether access was restored |
| Login decline | Equal-period change under an unchanged event contract | Product use, channels, SSO policy, roles, and customer context |
What guardrails should login reporting use?
- Avoid universal “healthy logins per month” thresholds, mixed identity flows, authentication-as-active-user definitions, frequency-as-value claims, and churn conclusions from a decline alone.
- Keep authentication metrics on an access or reliability dashboard when possible. In a health report, label their purpose and expose successes, failures, flow type, affected identities, and post-login behavior.
- Let identity or security teams own the authentication contract; product and customer teams should own downstream workflow definitions.
In Hymetry, move from the account in Companies to relevant product areas and grouped pages, the people in Users, and selected Visits. That supports evidence-based customer-success reviews without claiming to know intent or renewal. See also the guide to company-level product usage.
Frequently asked questions
Are logins a good customer health metric?
They are useful access and recency evidence, but usually too ambiguous to lead customer health.
How are active users different from logins?
A login is an access event. An active user is a distinct person meeting a documented behavioral rule in a period.
What should replace login count?
A combination of meaningful completion, recurrence, breadth, penetration, concentration, trend, outcomes, and selected qualitative or session evidence.
Does a login decline mean likely churn?
No. It can reflect identity architecture, cadence, channel shift, account change, missing data, or genuine disengagement.
How many monthly logins indicate health?
No universal threshold is defensible; expectation depends on workflow, role, lifecycle, account, channel, and authentication design.
Is first login a valid activation metric?
It can confirm access as an onboarding prerequisite, but should be followed by setup or the first meaningful workflow milestone.
Sources
Methodology and limitations
The guide separates authentication, session, interaction, adoption, and outcome evidence. The fictional account examples and signal ladder are explanatory frameworks, not universal health benchmarks.
Source directory
- Hymetry demo Companies view
- Google research on the HEART metrics framework
- NIST digital identity session-management guidance
- OWASP Session Management Cheat Sheet
- OAuth 2.0 authorization framework
- OpenID Connect Core specification
- Microsoft Entra single sign-on overview
- Google Analytics user metrics
- Google Analytics session definition
- Google Analytics user engagement guidance
- Amplitude analytics definitions
- Snowplow web session tracking documentation
- Mixpanel group analytics documentation