Champion, power user, backup champion, and usage concentration
The words champion and power user are often used as if they describe the same person. They do not. One describes observed usage intensity; the other includes an organizational role that behavioral data cannot establish by itself.
Champion status therefore cannot be assigned from activity volume alone. A highly active administrator may configure permissions, integrations, or billing without influencing wider adoption. Conversely, a manager who rarely signs in may still sponsor the product and encourage use. Behavioral evidence can identify likely contributors and possible dependencies; customer context is needed to confirm the organizational role.
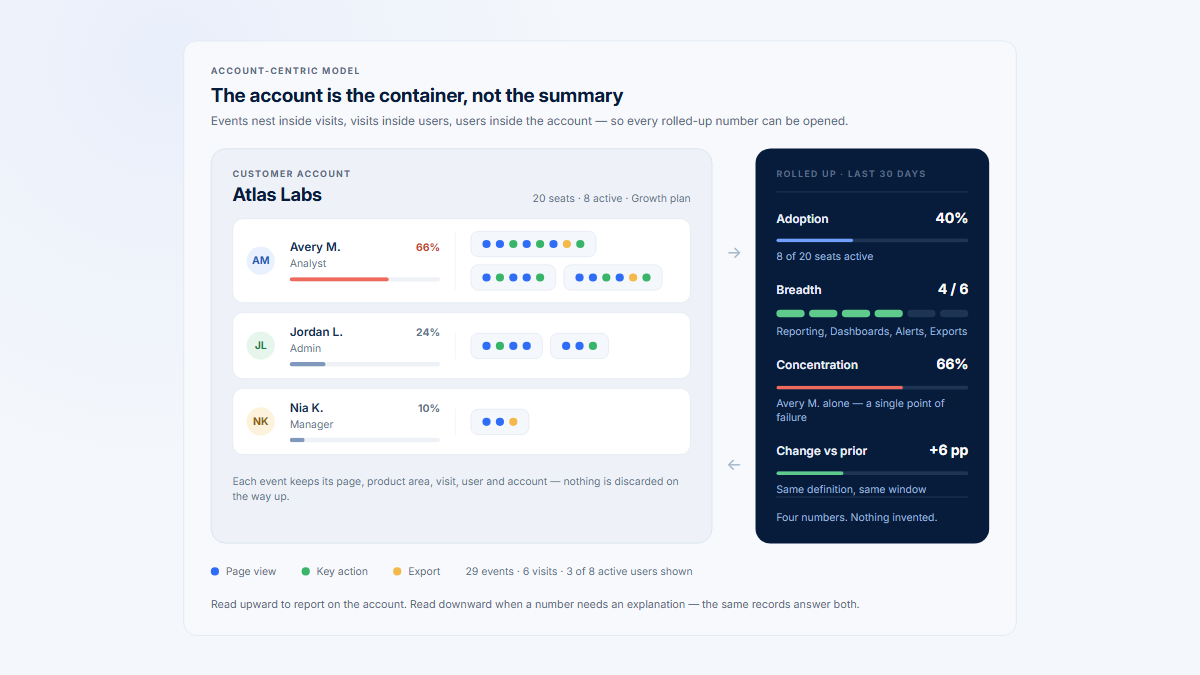
This distinction is central to account versus user adoption. Account totals tell you what the customer organization did. User distribution tells you who made that total possible.
Why total account usage can mislead
Two accounts can produce the same totals while carrying very different operational and adoption patterns. Consider two fictional accounts measured over the same 30-day period.
Illustration only
| Metric | Account A: distributed usage | Account B: concentrated usage |
|---|---|---|
| Meaningful actions | 100 | 100 |
| Engaged time | 300 minutes | 300 minutes |
| Visits | 20 | 20 |
| Product areas used | 4 | 4 |
| Active users | 5 | 5 |
| Meaningful-action distribution | 20, 20, 20, 20, 20 | 85, 5, 4, 3, 3 |
| Top-user concentration | 20% | 85% |
| Users completing the core workflow | 5 | 1 |
At the account-total level, the two customers look identical. Account A distributes the work evenly. Account B has four nominally active users, but one person completes nearly all meaningful work and touches every product area.
The difference does not prove that Account B is unhealthy. One specialist may be expected to create reports, configure integrations, or prepare outputs that many colleagues consume elsewhere. But the distribution changes the questions a product or customer-success team should ask:
- Could another user continue the workflow if the top user became unavailable?
- Are the other four users receiving value, or merely opening the product?
- Is one person carrying a collaborative workflow that should involve several roles?
- Does the top user hold permissions or knowledge that no one else has?
- Is concentration stable and expected, or did it rise because participation declined?
This is why a B2B product analytics model should preserve the users behind every account total rather than treating the account as one undifferentiated event bucket.
Transparent metrics for product usage concentration
Concentration metrics should be easy to calculate, easy to explain, and connected to the activity that represents product value. Begin with top-user and top-two-user shares. Add broader distribution measures when the account or workflow is important enough to justify more detail.
Top-user concentration
meaningful activity from the account’s most active user ÷ total meaningful account activity × 100
Let ai be meaningful activity from user i, and let a(1) be the largest user value. Then:
C1 = a(1) ÷ Σai × 100%
For an account with 260 meaningful actions where the top user completed 203:
203 ÷ 260 × 100 = 78.1%
The activity measure can be:
- meaningful actions;
- completed workflows;
- engaged time;
- active days;
- relevant Visits;
- role-appropriate use of a critical product area.
Choose the measure closest to the product’s value. Do not default to raw event count simply because it is easy to aggregate. A user can generate many events through repetitive navigation, a noisy interface, or automated activity without producing more customer value.
Top-two-user concentration
meaningful activity from the account’s two most active users ÷ total meaningful account activity × 100
Let a(2) be the second-largest user value:
C2 = (a(1) + a(2)) ÷ Σai × 100%
If the top two users completed 203 and 29 of 260 meaningful actions:
(203 + 29) ÷ 260 × 100 = 89.2%
Top-two concentration helps answer a different question from top-user concentration: is there at least one substantial backup contributor? A high top-two share with a much lower top-user share may indicate that two people share ownership. A high value for both metrics may indicate one dominant user plus a light secondary user rather than true backup coverage.
Active-user distribution
One percentage cannot describe the full account. Compare several layers of participation:
| Measure | Transparent calculation | Question it answers |
|---|---|---|
| Eligible-user count | Users whose role, access, plan, and lifecycle make the workflow relevant | Who could reasonably participate? |
| Active-user coverage | active users ÷ eligible users × 100 |
How many eligible people used the product at all? |
| Meaningful-user coverage | users completing a meaningful action ÷ eligible users × 100 |
How many people did more than open or browse? |
| Core-area participation | users using the critical product area ÷ eligible users × 100 |
How broadly is the value-bearing workflow used? |
| Multi-period continuity | Users active in a documented number of recent periods | Is participation recurring rather than one-off? |
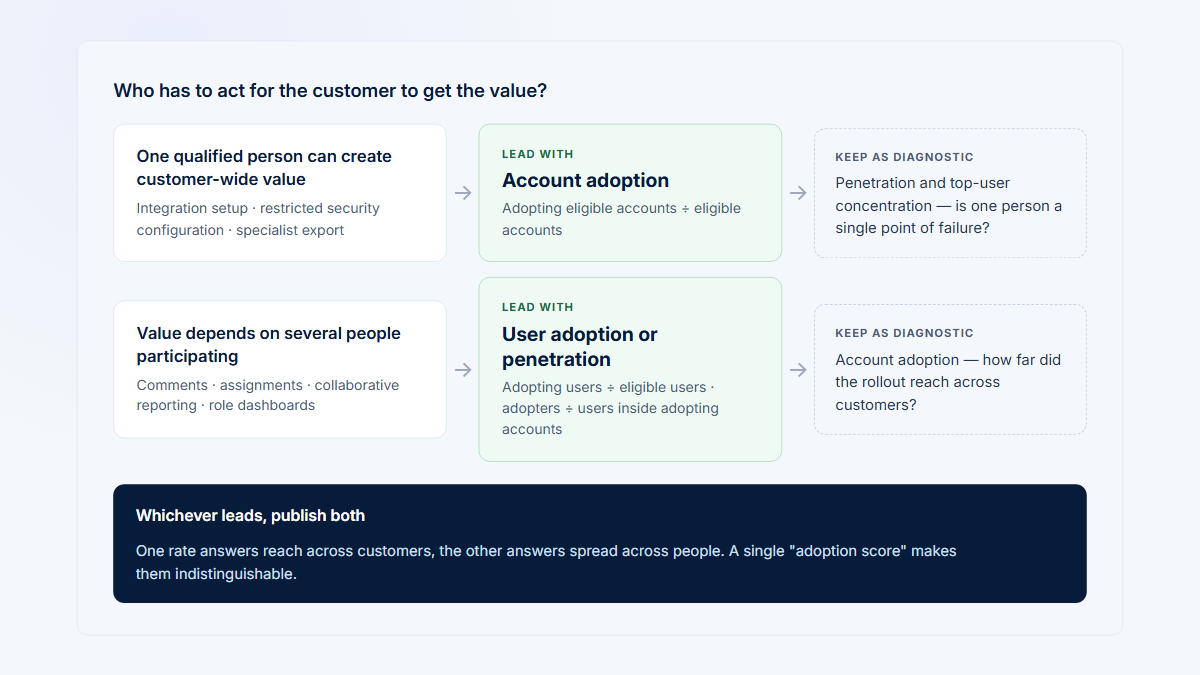
Keep the denominator explicit. Licensed seats, invited users, known employees, and eligible workflow users are not interchangeable. A security configuration feature may have two eligible administrators in a 500-person customer. A collaborative project workflow may have 40 eligible operators in the same customer.
Optional: a Herfindahl–Hirschman-style concentration index
When several users contribute meaningful activity, a squared-share index summarizes the whole distribution rather than only the top one or two users. This is adapted from the general Herfindahl–Hirschman concentration concept.
HHI-style user concentration
H = Σsi2
Here, si is each active user’s share of meaningful account activity expressed as a decimal, and all user shares sum to 1. With decimal shares, the index ranges from 1 ÷ n when n users contribute equally to 1 when one user produces all activity.
For six equal contributors:
6 × (1 ÷ 6)2 = 0.167
For one user at 80% and five users at 4% each:
0.802 + 5 × 0.042 = 0.648
Meaningful activity versus raw activity
A concentration calculation is only as useful as its numerator. Raw activity can exaggerate dependence on the person who navigates most, troubleshoots most, or triggers the most instrumented interface elements.
| Easy-to-count signal | Why it may mislead | Closer-to-value alternative |
|---|---|---|
| Page views | Repeated navigation may reflect discovery, confusion, or a workflow split across many pages. | Completion of a defined workflow, plus recurring use when recurrence matters. |
| Mouse movement | Movement is not reliable evidence of intent, progress, or value. | A defined interaction or completed value-bearing action. |
| Raw click count | A difficult task can generate more clicks than an efficient task. | Successful task outcome, report created, approval completed, or integration configured. |
| Total elapsed time | Long time can represent productive work, a blocked workflow, waiting, or inactivity. | Engaged time interpreted alongside outcome, product area, active days, and Visit evidence. |
| All events | Background syncs, service accounts, internal staff, support activity, tests, and noisy instrumentation can dominate totals. | Customer-generated, deduplicated, role-appropriate events with documented exclusions. |
Prefer relevant workflow completion, meaningful actions, recurring use, role-appropriate feature use, and product-area participation. For a reporting product, creating or sharing a report may be more informative than opening the Reporting page. For an approval product, completed approvals may matter more than time spent. For an administrator-only integration, a successful configuration and recurring automated output may matter more than the number of people clicking through setup.
Engaged time can still be useful, especially in products where customers perform sustained work. It should remain an observed activity signal rather than proof of attention or value. A long Visit may reveal deep work or friction; the surrounding actions and outcome determine which interpretation is more plausible.
Healthy specialization versus fragile dependency
High concentration is not inherently a defect. Many B2B products intentionally divide responsibilities by role. The analytical task is to determine whether the concentration matches the workflow’s design and the customer’s operating model.
| Healthy or expected specialization may include | Potential fragility may include |
|---|---|
|
|
These are interpretation prompts, not diagnoses. A specialist may intentionally centralize work. A broad account may temporarily concentrate during a migration. An early-stage rollout may begin with one champion before other users join. A mature collaboration account may look active while the rest of the team quietly stops. The same concentration rate can support different explanations.
A concentration and adoption-breadth matrix
Use two dimensions together: how concentrated meaningful activity is, and how broad adoption is across relevant users, roles, or product areas. Breadth should remain inspectable rather than collapsed into a vague headcount. The matrix helps choose what to inspect next; it does not assign automatic health labels.
Low concentration, broad participation
Meaningful use is distributed across several relevant users or roles, and the account uses the expected workflows.
Inspect next: confirm that participation recurs across periods, role coverage matches the workflow, and breadth represents value rather than superficial navigation.
High concentration, broad product breadth
One person may use many product areas while other users participate lightly. The product looks broadly adopted at the account level, but ownership may still be narrow.
Inspect next: identify who completes each critical workflow, whether permissions are distributed, whether the second contributor is recurring, and whether broad page coverage belongs almost entirely to the top user.
Low concentration, narrow product use
Several users share one focused workflow, but the account uses a small part of the available product.
Inspect next: determine whether the narrow workflow is the intended use case, a healthy specialist deployment, an onboarding stage, or a relevant expansion opportunity. Do not push unrelated features merely to increase breadth.
High concentration, narrow product use
One person owns one narrow workflow. This may be expected specialist use, an early champion-led rollout, or significant single-user dependency.
Inspect next: check role fit, lifecycle, backup ownership, permissions, expected collaboration, product fit, and whether other eligible users attempted and stopped.
For a deeper distinction between how much of the product is used and how intensively it is used, link this analysis with adoption breadth versus depth. Concentration adds a third question: who produces that breadth and depth inside the account?
Worked B2B example: five accounts with different concentration stories
All company names and data in this section are fictional and illustrative. Assume the product has four relevant product areas: Dashboard, Reporting, Integrations, and Projects. “Meaningful actions” combine documented, role-appropriate outcomes such as completing a report, sharing an output, approving work, configuring an integration, or completing a core project workflow. The example does not use raw event volume.
Illustration only
| Account | Eligible users | Active users, current / previous | Meaningful actions | Top-user share, previous → current | Top-two share, current | Product areas used | Observed role coverage |
|---|---|---|---|---|---|---|---|
| Atlas Labs | 12 | 6 / 7 | 240 | 27% → 24% (−3 pp) | 46% | 3 of 4 | Administrator, three analysts, manager, viewer |
| Northstar Works | 14 | 4 / 5 | 260 | 69% → 78% (+9 pp) | 89% | 4 of 4 | One analyst and three light viewers; no substantial second workflow owner |
| Beacon Systems | 11 | 6 / 6 | 180 | 59% → 61% (+2 pp) | 74% | 3 of 4 | Administrator, three operators, two viewers |
| Meridian Group | 20 | 5 / 11 | 220 | 38% → 72% (+34 pp) | 83% | 4 of 4 | One operator, one analyst, three viewers; prior champion and manager inactive |
| Harbor Analytics | 8 | 5 / 5 | 150 | 40% → 38% (−2 pp) | 67% | 3 of 4 | Administrator, two analysts, approver, viewer; two users share critical workflows |
Atlas Labs: distributed Reporting usage
Six active users produce 240 meaningful actions. The most active user contributes 58 actions, or 24.2%; the top two contribute 110, or 45.8%. Reporting work is distributed among several analysts, with manager and viewer participation. The small decline in top-user share is not automatically important, but the pattern provides visible evidence that one person does not carry the entire workflow.
Northstar Works: high totals hide one-person ownership
Northstar has the largest total in the table and touches all four product areas. Yet one user produces 203 of 260 meaningful actions, or 78.1%, and the top two users produce 89.2%. The account has 14 eligible users but only four active users, three of whom are light viewers. Concentration also rose by 9 percentage points.
This does not establish that Northstar will churn. It does justify investigation. The main analyst may be a legitimate specialist who creates reports and dashboards for everyone else. Alternatively, invitations, permissions, onboarding, workflow design, or internal ownership may be preventing wider participation. The next step is to inspect the other users, their role-appropriate actions, and relevant Visits before recommending broader rollout.
Beacon Systems: concentrated administration may be expected
Beacon’s top user contributes 61.1% of meaningful activity, but the distribution matches an administrator-led Integrations workflow. Several operators and viewers use downstream product areas, and the administrator configures connections whose outputs may be consumed by other people.
The account may be operating exactly as designed. Still, two questions remain: does another person have sufficient permissions to maintain the integration, and can the team verify that downstream users continue receiving value? Product data can show who configures, operates, or views; it may not observe outputs consumed in another system or prove that knowledge has been documented.
Meridian Group: change over time matters more than the snapshot
Meridian still produces 220 meaningful actions and uses all four product areas. A snapshot might therefore look acceptable. The historical comparison tells a different story: active users fell from 11 to 5, and top-user share rose from 38% to 72%, an increase of 34 percentage points, after the prior champion became inactive.
One remaining operator appears to have absorbed much of the work. That may be a planned handoff, a temporary transition, or a fragile dependency. The important evidence is the change: stable totals and stable product breadth are now produced by fewer people. The team should inspect which users stopped, whether permissions transferred, whether the second contributor remains active, and whether the account’s expected cadence changed.
Harbor Analytics: lower volume, stronger backup ownership
Harbor produces only 150 meaningful actions, less than Northstar, but two users share critical workflows. The top user contributes 38%, the top two contribute 67%, role coverage includes administration, analysis, approval, and viewing, and participation is stable across periods.
Lower volume does not make Harbor weaker. Its usage appears more resilient because critical work is not locked to one person. The team should still confirm that the two contributors can cover each other’s permissions and responsibilities, but the distribution supplies better evidence of backup ownership than Northstar’s higher total.
Concentration over time is often more useful than one snapshot
An absolute concentration rate needs context. A stable 70% top-user share may be normal for a specialist workflow. A move from 35% to 70% in one period may indicate a handoff, a role change, or disappearing participation. Compare equal-length completed periods that match the product’s expected cadence.
Percentage-point change in concentration
current concentration rate − previous concentration rate
If top-user share moves from 55% to 75%, the increase is 20 percentage points. Use percentage points for the difference between rates. Keep relative percentage change separate if it is needed for another purpose.
Patterns worth reviewing include:
- stable total usage with a falling active-user count;
- an increasing top-user share;
- the disappearance of the second-most-active user;
- product breadth remaining stable but being owned by fewer people;
- champion activity dropping without another user replacing the workflow;
- new users gradually contributing a larger share across several periods;
- a temporary concentration spike during onboarding, migration, or periodic close;
- a denominator change caused by new seats, role changes, or revised eligibility.
Keep current and previous values visible rather than showing only an arrow or status. A team should be able to see whether concentration changed because the top user did more, other users did less, eligible users changed, automated activity appeared, or the account’s workflow cadence shifted.
Role coverage matters more than simply adding users
“More users” is not a universal goal. B2B workflows distribute value across roles. The relevant question is whether the account has the people needed to configure, operate, review, approve, and consume the workflow.
| Role | Possible product evidence | Coverage question |
|---|---|---|
| Administrator | Configuration, permissions, invitations, integration maintenance | Can someone else maintain access and setup? |
| Operator | Recurring completion of the core workflow | Is daily or weekly work shared appropriately? |
| Analyst | Analysis, report creation, export, or interpretation | Does more than one person understand the analytical workflow? |
| Manager | Reviewing results, sharing outputs, monitoring progress | Is the product connected to decision-making? |
| Viewer | Recurring consumption of role-relevant outputs | Are viewers receiving value without unnecessary operational actions? |
| Approver | Review and sign-off at required workflow stages | Can the workflow continue when one approver is absent? |
An account with ten viewers but no active administrator may still be operationally fragile. An account with one administrator and many consumers may be healthy when administration is intentionally centralized and backup permissions exist. Do not require every user to use every product area. Evaluate whether each relevant role receives or creates the value expected from that role.
Signals of backup champion or backup-owner coverage
Product data is better at identifying backup contributors than proving backup champions. Look for observable continuity signals, then confirm influence, knowledge, and responsibility through customer context.
| Observable evidence | Reason it matters | What remains unknown |
|---|---|---|
| Another user completes the core workflow | The account has more than one demonstrated operator. | Whether the person can lead, teach, or advocate internally. |
| A second user is active across several periods | Backup participation is recurring rather than a one-off visit. | Whether the user would assume ownership during a transition. |
| Permissions are distributed | Configuration or access may not be locked to one person. | Whether the second user understands the configuration. |
| Multiple users use critical product areas | Core value is not entirely produced by the top user. | Whether the roles are interchangeable or complementary. |
| A second user creates or shares outputs | Another person can produce visible account value. | Whether colleagues rely on or trust those outputs. |
| Account activity continues while the primary user is inactive | The workflow can continue without the usual top contributor. | Why the primary user is absent or how long continuity will last. |
| Configuration and workflow activity appear across several users | Knowledge may be distributed rather than locked to one account profile. | Whether documentation, organizational knowledge, and internal advocacy are truly shared. |
Use cautious labels such as “backup contributor,” “secondary owner candidate,” or “possible backup champion” until the customer confirms the organizational role. High activity can identify a person worth speaking with; it cannot reveal private influence networks or succession plans.
A practical champion-concentration investigation workflow
- Define meaningful account activity. Choose the action, workflow, engaged-time measure, active-day rule, or relevant Visit definition that best represents value. Document exclusions for automation, staff, support, demos, and test activity.
- Identify the expected participating roles. Define who should configure, operate, analyze, approve, manage, or consume the workflow. Do not use every known seat as the default denominator.
- Calculate top-user and top-two-user concentration. Keep the raw user contributions available so a reviewer can verify each percentage.
- Inspect active-user and role distribution. Compare eligible users, active users, meaningful contributors, recurring contributors, and role coverage. Use the account’s Users rather than stopping at the company total.
- Compare with the previous period. Show current and previous top-user share, top-two share, active-user count, and meaningful-user coverage. Use percentage-point change for rates.
- Review product-area breadth. Use product areas and grouped pages to see whether one user owns every important workflow or whether roles divide work appropriately.
- Identify dropped or inactive users. Determine whether concentration rose because the top user increased activity, other users stopped, a role changed, or eligibility shifted.
- Inspect relevant Visits. Open Visits for the top user, the second contributor, and users who attempted but did not complete the workflow. Use session evidence to investigate behavior rather than guessing intent from a percentage.
- Add customer and lifecycle context. Consider onboarding stage, account age, periodic workflow cadence, team changes, plan access, customer goals, permissions, support history, and what the customer-success team knows from conversations.
- Decide whether concentration is expected, temporary, or worth addressing. Preserve specialist ownership when it is appropriate. Escalate investigation when required collaboration, continuity, or backup ownership is missing.
- Remeasure after action. Use the same activity definition, eligibility rule, period length, and exclusions. Check whether backup participation, role coverage, workflow completion, and concentration changed.
Possible actions after the investigation
The response should follow the evidence, not a generic threshold. Appropriate actions may include:
- inviting or onboarding backup users for a critical workflow;
- distributing administrator or approval permissions safely;
- documenting critical setup, configuration, and handoff steps;
- encouraging collaborative workflows when collaboration creates product value;
- improving team invitations and permission explanations;
- creating role-specific onboarding instead of sending every user through the same path;
- helping the customer identify secondary owners;
- investigating why other users stop after invitations, setup, or first use;
- preserving specialist ownership when concentration is intentional and effective;
- tracking whether a champion-led rollout gradually gains additional contributors.
Common champion-concentration mistakes
| Mistake | Why it fails | Better approach |
|---|---|---|
| Calling the most active user a champion | Activity does not prove advocacy, influence, knowledge sharing, or decision authority. | Use “top user” or “power user” until organizational evidence confirms champion behavior. |
| Assuming high concentration is always bad | Administrator, billing, security, export, and specialist workflows may be intentionally concentrated. | Interpret concentration against workflow design and role expectations. |
| Assuming broad usage is always better | More users or product areas can add noise without increasing value. | Measure role-appropriate participation and relevant product breadth. |
| Using raw event volume | Noisy interfaces, repeated clicks, and heavily instrumented pages can dominate the calculation. | Use meaningful actions, outcomes, recurring use, or clearly defined engaged activity. |
| Ignoring role ownership | The same rate has different meaning for an administrator-only feature and a collaborative workflow. | Define expected administrators, operators, analysts, managers, viewers, and approvers. |
| Ignoring automated activity | Service accounts, integrations, background jobs, and bots can look like power users. | Separate automation from human activity and document when automation itself represents value. |
| Ignoring account lifecycle | Early onboarding often begins with one champion; a mature deployment may require broader continuity. | Compare accounts within appropriate onboarding, active, migration, or renewal contexts. |
| Looking at one period | A snapshot hides whether concentration is stable, improving, or rising because users disappeared. | Show equal-length current and previous periods and the raw contributing-user counts. |
| Letting one large user hide declining participation | Stable account totals can mask falling active-user and meaningful-user counts. | Pair volume with top-user share, top-two share, active users, and role coverage. |
| Using universal red, amber, and green thresholds | Products, workflows, roles, account sizes, and cadences differ. | Calibrate with historical and peer context while keeping thresholds explainable. |
| Treating concentration as guaranteed churn risk | Product behavior does not reveal every factor behind renewal, budget, leadership, fit, or procurement. | Use concentration as an investigation signal, not a deterministic prediction. |
| Counting support or internal users as customer champions | Vendor staff, implementation partners, QA, and demo users can inflate activity without representing customer adoption. | Exclude or label non-customer identities before calculating account concentration. |
| Ignoring value created for other people | One user may legitimately create reports, configurations, or outputs consumed by many others. | Inspect downstream participation and confirm off-product consumption through customer context. |
| Hiding concentration inside an opaque health score | A final score can move without showing which user or workflow caused the change. | Keep the component, formula, trend, contributing users, and source evidence visible. See the customer health score framework. |
How Hymetry connects account usage to the users behind it
Hymetry is account-centric product intelligence for B2B SaaS. It connects Companies, Users, product areas and grouped pages, account-level engagement, user distribution, and Visits so a team can inspect who produced an account signal and what happened in the relevant sessions.
- Company signal — start with account-level activity, adoption breadth, active users, engaged time, or movement that deserves review.
- Product-area usage — see which product areas and grouped pages produced the account total and whether breadth belongs to one person or several roles.
- Contributing users — inspect the top user, second contributor, active-user distribution, dropped users, and role-appropriate participation.
- Relevant Visits — open the sessions that can show paths, timing, interactions, and replay context behind the concentration pattern.
Company signal → Product-area usage → Contributing users → Relevant Visits
This path keeps concentration inspectable instead of burying it inside one unexplained score. A reviewer can see the selected period, meaningful activity definition, top-user and top-two shares, active users, roles, product areas, and source Visits before deciding whether the pattern is expected or worth addressing.
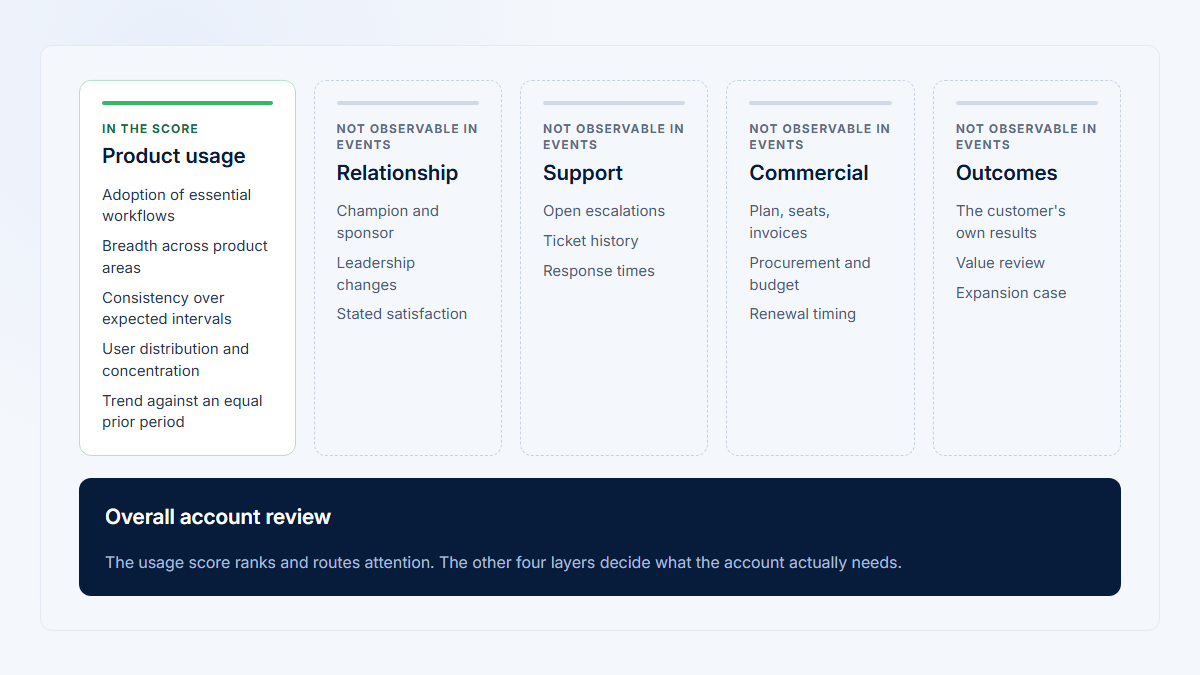
Hymetry does not claim that activity volume automatically identifies a true internal champion, proves that organizational knowledge is distributed, or predicts churn. It helps product and customer-success teams find the account, user, product-area, and session evidence needed for a more informed review. The same account-first approach is explained in the guide to measuring product usage by company.
Frequently asked questions
What is champion concentration risk?
Champion concentration risk is the possibility that an account’s healthy-looking product usage depends heavily on one person. Measure the distribution of meaningful activity, then interpret it with roles, participation breadth, product-area ownership, lifecycle, trend, and backup coverage. It is an investigation signal, not proof that the account is unhealthy.
What is the difference between a product champion and a power user?
A power user is defined by relatively high or advanced usage. A product champion also promotes, supports, or leads adoption inside the organization. Product activity can identify a likely power user and a possible champion candidate, but it cannot prove internal advocacy or influence.
What is a good top-user concentration percentage?
There is no universal percentage. A high share may be expected for billing, security, administration, integrations, or specialist outputs. The same share may be concerning for a collaborative workflow. Compare the account with its own history, relevant peers, expected roles, eligible users, lifecycle, product cadence, and top-two share.
Which activity should be used in the formula?
Use the measure closest to product value: completed workflows, meaningful actions, recurring use, active days, engaged time with outcome context, relevant Visits, or role-appropriate product-area participation. Avoid raw event count unless each event has comparable meaning and automation, internal activity, and instrumentation noise are controlled.
Should I use top-user or top-two-user concentration?
Use both. Top-user share shows dependence on the leading contributor. Top-two share shows whether activity is still dominated by a very small pair and whether a substantial second contributor may exist. Neither metric proves that the second person has backup permissions, knowledge, or organizational influence.
Can product analytics identify a backup champion?
It can identify evidence of backup ownership: another user completes the core workflow, returns across periods, uses critical product areas, holds permissions, creates outputs, or sustains activity while the primary user is inactive. A customer conversation is still needed to confirm advocacy, knowledge, authority, and willingness to take ownership.
Does high usage concentration mean the customer will churn?
No. Concentration can indicate expected specialization, early rollout, temporary transition, or fragile dependency. Renewal also depends on factors not visible in product data, including budget, leadership, procurement, satisfaction, outcomes, and product fit. Use concentration to prioritize investigation, not to claim a future outcome.
How often should champion concentration be measured?
Match the window to the workflow cadence. A daily operational product may support weekly or rolling multi-week comparisons. Monthly reporting, financial close, or quarterly planning requires longer windows. Compare completed periods of equal length and preserve the same activity, eligibility, and exclusion rules.
Sources
The organizational-champion literature below is used to define the champion role and emphasize its contextual, multidimensional nature. Much of that research comes from innovation and healthcare implementation, so it is not treated as a B2B SaaS churn benchmark. Official analytics documentation is used for account and user data-modeling concepts. The concentration formulas, decision framework, fictional account data, calculations, and visual concepts in this guide are original applications. No universal SaaS concentration threshold is claimed.
- Howell, Jane M., and Christopher A. Higgins. “Champions of Technological Innovation.” Administrative Science Quarterly, 35(2), 1990. https://doi.org/10.2307/2393393
- Shea, Christopher M. “A conceptual model to guide research on the activities and effects of innovation champions.” Implementation Research and Practice, 2021. https://doi.org/10.1177/2633489521990443
- Pettersen, Sissel, Hilde Eide, and Anita Berg. “The role of champions in the implementation of technology in healthcare services: a systematic mixed studies review.” BMC Health Services Research, 2024. https://doi.org/10.1186/s12913-024-10867-7
- U.S. Department of Justice, Antitrust Division. “Herfindahl–Hirschman Index.” https://www.justice.gov/atr/herfindahl-hirschman-index
- Office for National Statistics. “Percentages and percentage points.” https://service-manual.ons.gov.uk/content/numbers/percentages
- Mixpanel. “Group Analytics: Group users together as an aggregated unit of measurement.” https://docs.mixpanel.com/docs/data-structure/group-analytics
- Mixpanel. “Reports Overview.” https://docs.mixpanel.com/docs/reports
- Mixpanel. “Analyze User Engagement.” https://docs.mixpanel.com/guides/strategic-playbooks/guide-to-product-analytics/analyze-user-engagement
- Twilio Segment. “Spec: Group.” https://www.twilio.com/docs/segment/connections/spec/group
- PostHog. “Group analytics.” https://posthog.com/docs/product-analytics/group-analytics
- PostHog. “Product analytics best practices.” https://posthog.com/docs/product-analytics/best-practices
- Hymetry. “Companies: Account Intelligence.” https://www.hymetry.com/product/companies/
- Hymetry. “User Intelligence for B2B SaaS.” https://www.hymetry.com/product/users/
- Hymetry. “Pages Analytics.” https://www.hymetry.com/product/pages/
- Hymetry. “Visits.” https://www.hymetry.com/product/visits/
- Hymetry. “Customer Success.” https://www.hymetry.com/use-cases/customer-success/