First, define what you mean by breadth and depth
There is no single industry-standard definition of adoption breadth or adoption depth.
Google’s HEART framework uses Adoption for new users starting to use a product or feature. It describes frequency, intensity, and depth of interaction as possible behavioral proxies for Engagement. Amplitude’s North Star material uses breadth for how many users engage, depth for the level of engagement they reach, and frequency for how often they engage.
Vendor definitions also differ. Pendo’s feature-adoption glossary uses breadth for how widely a feature spreads across a target user population and depth for repeated or process-level use by important user types. An earlier Pendo BDF framework instead defines breadth as the number of active people within an account and depth as usage of selected sticky features. Gainsight has described breadth as how much of the product an account uses and depth as how often it uses the product.
The broad agreement is not a universal formula. It is that coverage, intensity, recurrence, and reach answer different questions and should not be assumed to mean the same thing.
To avoid ambiguity, this article uses the following definitions:
- Account adoption breadth: coverage of relevant product areas or grouped capabilities within one account.
- User breadth: coverage of the capabilities relevant and available to one user.
- Adoption depth: meaningful intensity, recurrence, completion, or quality within an adopted capability.
- User penetration: the share of eligible or active people who participate in a capability.
- Concentration: how much activity depends on one user or a small group.
Other frameworks are valid, but a team should name its unit explicitly. “Product-area breadth,” “feature reach,” “user breadth,” and “account breadth” are clearer than using the word breadth alone.
What is adoption breadth?
Adoption breadth describes how widely usage covers the parts of the product that are relevant to the measured entity.
For a B2B account, a practical product-area formula is:
Account adoption breadth
Account adoption breadth =
relevant product areas adopted by the account
÷ relevant product areas available to the account
× 100
A simpler count is also useful:
Adopted product areas
Adopted product areas =
number of relevant product areas that meet
their documented adoption threshold
The percentage helps compare accounts with different eligible product sets. The count preserves a concrete answer such as “three product areas adopted.” Showing both is often more understandable than showing only a percentage.
User breadth
User breadth applies the same idea to one person:
User breadth
User breadth =
relevant capabilities used by the user
÷ relevant capabilities available to that user
× 100
The denominator should reflect the person’s role and permissions. A finance user should not appear under-adopted because they do not configure developer tools. An administrator should not be expected to complete every analyst workflow.
Breadth should use meaningful product structure
Account breadth is not the number of distinct URLs someone opened.
A defensible hierarchy
Product area
→ Grouped page or feature
→ Normalized raw page
A product area might be Reporting. A grouped page or feature might be Scheduled reports. Several normalized paths, such as /reports/:id/schedule and /workspace/:id/reports/:id/schedule, may support that one capability.
Counting every raw path as a separate feature inflates breadth when:
- identifiers create many URL variants;
- one workflow spans several routes;
- the same capability has list, detail, edit, and confirmation pages;
- navigation opens technical or transitional paths;
- a user repeatedly moves between steps without completing the workflow.
Use product areas or grouped capabilities for breadth. Use normalized raw pages when exact path or action evidence matters.
What is adoption depth?
Adoption depth describes how meaningfully an account or user engages inside a capability that has already crossed its adoption threshold.
There is no universal depth formula. Depending on the product, useful depth signals may include:
- meaningful actions completed;
- repeated use;
- active days;
- recurring sessions or Visits;
- workflow completion;
- outputs created, saved, shared, published, or exported;
- usage volume appropriate to the product;
- advanced capability use;
- depth within one end-to-end workflow;
- recurrence across several comparable periods.
A practical definition template is:
Depth within an adopted capability
Depth within an adopted capability =
a documented combination of meaningful-action volume,
recurrence, completion, and active-use frequency
This is a framework, not a universal equation. The components should be selected for the workflow being measured.
For example, depth in a reporting capability could include:
- reports created;
- reports completed successfully;
- reports scheduled;
- active reporting days;
- repeat use across several weeks;
- reports shared with other users.
Depth in a one-time integration setup would need a different definition. Successful configuration and continued data flow may matter more than repeated setup-page activity.
Keep the components separate when possible
A composite depth score can be convenient, but it hides trade-offs. Two accounts can receive the same score for very different reasons:
- one has many actions on one day;
- another completes fewer actions across several weeks;
- one completes the workflow successfully;
- another spends a long time retrying the same step.
A component profile is usually easier to explain:
| Depth component | Question it answers | Important caveat |
|---|---|---|
| Meaningful-action volume | How much relevant work was completed? | Counts are not comparable when workflows have different natural volumes. |
| Active days | On how many days did meaningful use occur? | A monthly workflow should not be judged by a daily expectation. |
| Recurrence | Did use repeat across sessions or periods? | Repeat use is not required for every one-time capability. |
| Completion | Did users reach the intended workflow outcome? | Not every workflow has one clear endpoint. |
| Output evidence | Was something saved, shared, scheduled, published, or exported? | Some valuable outcomes are not represented by a saved object. |
| Advanced use | Did the account use more specialized capability? | Advanced does not automatically mean more valuable. |
| Engaged time | How much observed active product time occurred? | More time can reflect useful work or unnecessary friction. |
Depth is stronger when its components describe successful work, not merely activity.
Breadth, depth, recurrence, penetration, and concentration
These dimensions overlap, but they do not answer the same question.
| Dimension | Primary question |
|---|---|
| Breadth | How many relevant capabilities are adopted? |
| Depth | How meaningfully are adopted capabilities used? |
| Frequency or recurrence | How often does meaningful use repeat? |
| Account adoption | Did the account cross the threshold for this capability? |
| User penetration | How widely does the capability spread among eligible people? |
| Concentration | How dependent is usage on one user or a small group? |
Frequency is sometimes treated as part of depth and sometimes kept separate. Either approach can work if the definition is documented. Keeping frequency visible is often useful because an account can have high action volume in one burst without developing recurring use.
Consider the combinations:
- An account can open many product areas once and have broad navigation but little adoption depth.
- An account can use one product area deeply every working day.
- Many users can shallowly explore a newly announced capability.
- One user can deeply operate a workflow while everyone else remains inactive.
- A specialist can deeply adopt a workflow that is intentionally relevant to only one role, producing low user penetration without indicating a problem.
- An account can have broad product-area adoption even though different users own each area.
These are different product stories. A single “engagement” total cannot reliably distinguish them.
Eligibility: breadth needs a relevant denominator
Breadth becomes misleading when every product area is placed in every account’s denominator.
A relevant eligible set should reflect the product areas that were genuinely available and applicable during the measured period. Do not count an area when it was:
- unavailable on the account’s plan;
- irrelevant to the account’s use case;
- intended for a different role or team;
- blocked by prerequisite configuration;
- intentionally optional for the customer’s intended workflow;
- not yet released or available during the measured period.
Eligible product areas
Eligible product areas =
areas available on the plan
∩ relevant to the use case
∩ available to the applicable role or account
∩ available during the measurement period
This is not a database formula. It is a checklist for constructing the denominator.
Including every product area makes specialized customers appear artificially shallow. It can also make onboarding accounts look weak because they are judged against capabilities they have not reached yet.
Eligibility should be versioned or recoverable. If an account upgrades, changes use case, completes a prerequisite, or gains access to a newly released area, its denominator may change. The team should be able to explain when and why.
A page opening is not automatically adoption
A product area should not count as adopted merely because one user landed on one page.
Possible qualifying thresholds include:
- completing one meaningful action;
- completing required setup;
- using the capability in more than one session or Visit;
- using it on multiple active days;
- completing an end-to-end workflow;
- creating, saving, sharing, scheduling, or exporting an output;
- repeating a key action after the first discovery session.
The correct threshold depends on the capability.
One successful integration setup may be enough for an administrator-owned feature. A recurring planning workflow may require use on several active days. A reporting feature may require a completed report rather than an opened report page.
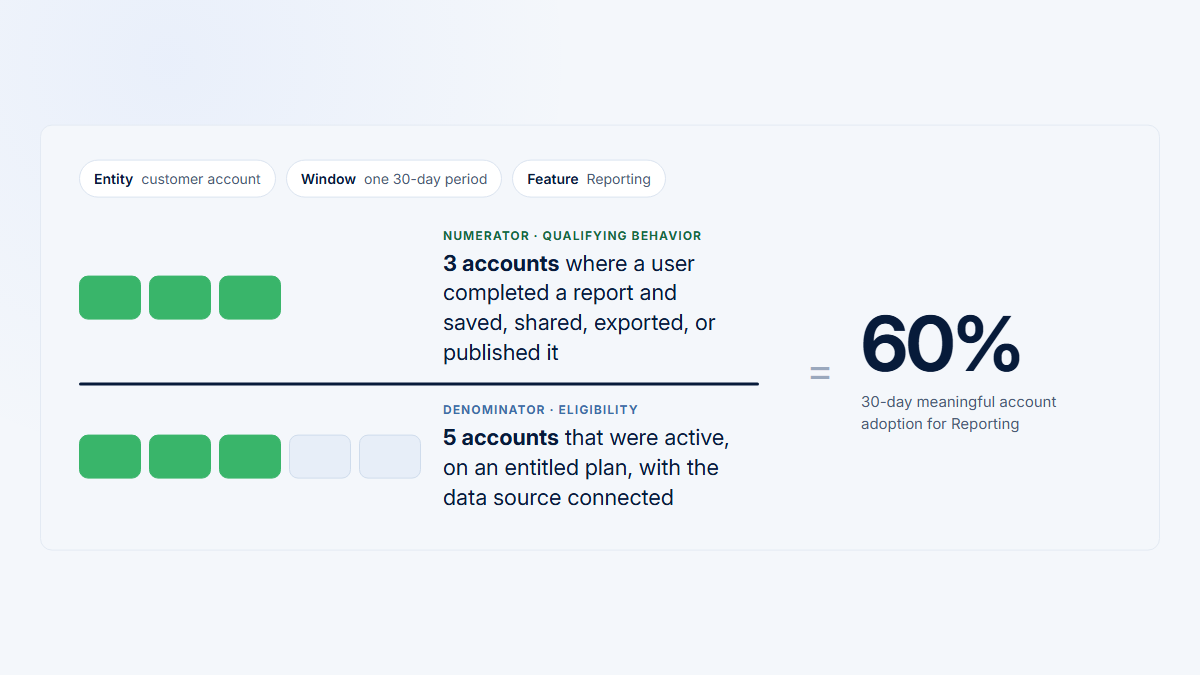
Document each area using four parts:
- The account or user being measured.
- The eligible denominator.
- The qualifying behavior.
- The measurement window.
For a fuller treatment of denominators and qualifying behavior, read the feature adoption rate guide.
Four adoption patterns
“High” and “low” should be calibrated to the product’s intended workflows, lifecycle stages, and customer segments. They are not universal percentage cutoffs.
High breadth, high depth
Possible interpretation: The product is embedded across several relevant workflows, and the account may receive value from multiple capabilities.
This can be a mature pattern, but it does not prove satisfaction, retention, or healthy user distribution.
Inspect next:
- which product areas produce meaningful outcomes;
- whether use recurs at the expected cadence;
- how activity is distributed across users and roles;
- whether one champion still carries a disproportionate share;
- whether high time or action volume includes retries or inefficient work;
- whether all counted areas remain relevant.
High breadth, low depth
Possible interpretation: The account discovers many capabilities but does not return, complete workflows, or produce meaningful outputs.
Possible causes include:
- onboarding-tour behavior;
- shallow navigation;
- announcement-driven exploration;
- unclear next actions;
- weak workflow completion;
- broad access without recurring adoption.
This pattern does not prove poor product fit. It may be a normal early exploration phase.
Inspect next:
- qualifying actions rather than page openings;
- first-use-to-second-use conversion;
- completion and output creation;
- active days after initial discovery;
- paths between product areas;
- selected Visits from users who explored but did not return.
Low breadth, high depth
Possible interpretation: The account has strong fit for one primary workflow, uses a specialist tool, or is intentionally focused.
It can also indicate an expansion opportunity, but low breadth is not automatically unhealthy.
Inspect next:
- whether the adopted workflow matches the account’s intended outcome;
- whether other areas are genuinely eligible and relevant;
- whether one specialist is the correct owner;
- whether the account has a backup user for a critical workflow;
- whether adjacent areas would add value or merely add noise;
- whether concentration creates operational fragility.
Low breadth, low depth
Possible interpretation: The account may be in early onboarding, have incomplete setup, use the product at a low natural cadence, have weak discovery, show poor fit, or be disengaging.
It may also mean the eligibility model is wrong.
Inspect next:
- lifecycle stage and account age;
- prerequisites and permissions;
- expected use frequency;
- whether the relevant users were invited;
- recent changes in active users;
- onboarding completion;
- comparable accounts at the same stage;
- selected Visits where setup or discovery needs explanation.
Worked B2B example
The following data is entirely fictional and illustrative. It does not describe Hymetry customers, benchmarks, or expected product performance.
Assume a fictional B2B operations product has six product areas:
- Core workspace;
- Projects;
- Reporting;
- Automations;
- Integrations;
- Administration.
The period is 30 days. An area counts as adopted when the account either:
- completes an area-specific meaningful action in at least two distinct sessions; or
- completes a successful one-time setup workflow for a capability designed to be configured once.
A page opening alone does not qualify.
Top-user concentration
Top-user concentration =
meaningful actions completed by the most active user
÷ meaningful actions completed by all contributing users
× 100
Illustration only
| Account | Eligible product areas | Adopted product areas | Breadth | Meaningful actions | Active days | Recurring use | Contributing users | Top-user concentration | Illustrative depth interpretation |
|---|---|---|---|---|---|---|---|---|---|
| Atlas Labs | 6 | Core, Projects, Reporting, Automations, Integrations | 83% | 1,260 | 18 | Four areas used in at least three separate weeks | 14 | 31% | Deep use across several workflows |
| Northstar Works | 5 | Reporting | 20% | 640 | 20 | Specialist reporting workflow completed on 16 days | 3 | 58% | Deep, recurring use in one focused workflow |
| Beacon Systems | 6 | Core, Projects, Reporting, Integrations | 67% | 28 | 4 | No adopted area reused after the first week | 11 | 18% | Broad exploration with shallow follow-through |
| Meridian Group | 4 | Core | 25% | 12 | 2 | Too early to establish recurrence | 2 | 75% | Early onboarding with insufficient evidence |
Do not compare the meaningful-action totals as if every action has equal value. The depth interpretation considers workflow type, recurrence, completion, and account context.
Atlas Labs: broad and deep, but still inspect concentration
Atlas adopted five of six eligible product areas and reused four of them across several weeks. That supports a broad-and-deep interpretation.
However, 31% of meaningful actions still came from one user. That may be acceptable, but the account could remain dependent on a champion. The next review should identify whether critical workflows have role-appropriate backup coverage.
Northstar Works: low breadth can still be healthy
Northstar adopted only one of five eligible areas, but its specialist reporting workflow was used on 16 active days and generated substantial meaningful work.
The account’s current outcome may depend primarily on that workflow. Low breadth therefore does not establish poor health. The team should first confirm that the narrow usage matches the customer’s intended use case. Adjacent areas may represent expansion possibilities, but they should not be treated as mandatory.
Beacon Systems: discovery without recurring adoption
Beacon opened raw pages across all six product areas, but only four crossed the minimal adoption threshold. Those areas generated few meaningful actions and none was reused after the first week.
This is a high-breadth, low-depth pattern. The team should inspect what happened after discovery: whether users understood the next action, completed workflows, created outputs, or returned after the initial exploration.
Meridian Group: do not compare onboarding with maturity
Meridian was only eight days into onboarding. Two product areas were not yet available during the measured period, leaving four eligible areas.
Its low breadth and low depth do not yet establish disengagement. The next review should focus on setup progress, invited roles, prerequisites, and the account’s expected onboarding sequence rather than comparing it with Atlas.
Account breadth is not user breadth
A B2B account can adopt the product broadly even when no single user has broad usage.
Different roles may own different workflows:
- administrators configure setup and integrations;
- analysts build reports;
- managers review dashboards;
- finance users manage billing.
The account can collectively adopt all four areas while every individual user remains focused on one or two.
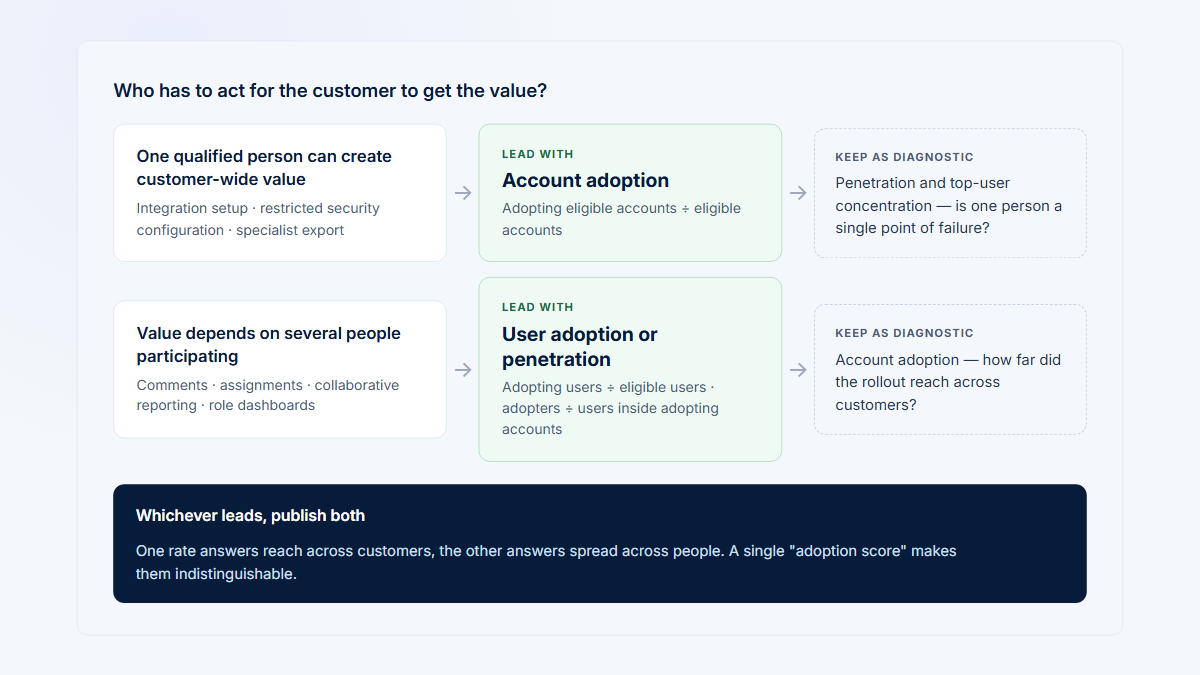
That can be a strong pattern because breadth is distributed according to responsibility. The useful question is not “Does every user use everything?” It is “Are the relevant workflows covered by the right roles?”
The opposite pattern is also possible. One power user may use nearly the entire product while the rest of the account remains inactive. User breadth is high for that person, but the account may be fragile.
Inspect:
- user distribution by product area;
- role coverage;
- champion concentration;
- backup champions;
- role-appropriate breadth;
- whether critical workflows depend on one person.
For a fuller decision guide, read the account adoption vs user adoption guide.
Breadth over time
A current breadth percentage is only one snapshot. Track the adopted-area set over comparable periods.
Useful measures include:
Newly adopted areas
Newly adopted areas =
current adopted areas − previous adopted areas
Retained adopted areas
Retained adopted areas =
current adopted areas ∩ previous adopted areas
Dropped areas
Dropped areas =
previous adopted areas − current adopted areas
Breadth change
Breadth change =
current breadth percentage − previous breadth percentage
Report percentage changes in percentage points where appropriate. A move from 40% to 60% breadth is an increase of 20 percentage points, not merely “up 20%.”
You can also track recurring breadth: the number or share of eligible areas that qualified as adopted in a documented number of recent periods. For example, an area might count as recurring when it met its threshold in at least three of the last four comparable weeks.
Current and previous periods should normally have comparable lengths. Otherwise, a longer period has more opportunity to collect distinct areas and will tend to look broader.
Low-frequency workflows require special care. A quarterly planning or billing process may disappear from a 30-day view without being abandoned. Use a measurement window that can observe the expected cadence.
Depth over time
Depth trends should remain tied to the workflow’s component signals.
Possible comparisons include:
- active days;
- sessions or Visits;
- meaningful actions;
- completed workflows;
- outputs saved, shared, scheduled, or exported;
- repeat completion;
- engaged time;
- retention of feature use;
- use across several comparable periods.
Show absolute values as well as percentage changes. A move from five to eleven meaningful actions is a 120% increase, but it is still only six additional actions. Small baselines can produce dramatic percentages without establishing a stable trend.
Interpret depth against:
- expected workflow cadence;
- account lifecycle;
- role;
- product plan;
- use case;
- relevant peer accounts;
- the account’s own prior pattern.
Avoid universal depth benchmarks. Ten monthly actions may be deep for a strategic-planning workflow and almost no activity for a daily operations tool.
Should all product areas count equally?
Unweighted breadth assigns one unit to every eligible product area. It is simple and easy to audit:
Unweighted breadth
Unweighted breadth =
adopted eligible areas
÷ all eligible areas
× 100
Possible alternatives include:
- Core-versus-optional weighting: core areas receive more weight than secondary capabilities.
- Role-specific weighting: each role is evaluated against the capabilities relevant to it.
- Use-case-specific eligible sets: the denominator changes according to the account’s intended workflow.
- Lifecycle-specific eligible sets: onboarding accounts are evaluated against the areas available at that stage.
When weighting is genuinely necessary, a transparent formula is:
Weighted breadth
Weighted breadth =
sum of weights for adopted eligible areas
÷ sum of weights for all eligible areas
× 100
Adjusting the eligible set is usually clearer than adding many weights. Complex weighting can become opaque, hard to maintain, and easy to manipulate.
If a weighted summary is used:
- document every weight;
- explain why it exists;
- version changes;
- preserve historical comparability;
- show the underlying adopted and missing areas alongside the score.
The summary should never make the evidence harder to inspect.
A practical decision framework
Use this process to measure adoption breadth and depth without collapsing them into one unexplained number.
Ten measurement decisions
- Define the account’s relevant product areas. Exclude unavailable, irrelevant, role-inappropriate, blocked, or not-yet-released areas.
- Define meaningful adoption for each area. Specify the action, completion, setup, recurrence, or output that qualifies.
- Choose the measurement period. Match it to the slowest important workflow cadence you need to observe.
- Calculate breadth. Show both the adopted-area count and percentage where useful.
- Select depth components for each workflow. Use meaningful volume, active days, recurrence, completion, or output evidence as appropriate.
- Inspect contributing users. Determine which people and roles create the account-level pattern.
- Check concentration. Measure whether one user or a small group carries critical activity.
- Compare with relevant context. Use lifecycle, use case, role, plan, and relevant peers rather than a universal benchmark.
- Review selected Visits when the pattern needs explanation. Start from a measurable signal instead of browsing random sessions.
- Reassess definitions when the product changes. Version product-area mappings, thresholds, and eligibility rules while preserving historical comparability.
Keep the measurement specification beside the metric. A breadth percentage without its eligible set and adoption threshold is not reproducible.
Common mistakes
| Mistake | Why it misleads | Better approach |
|---|---|---|
| Counting raw pages instead of meaningful capabilities | One workflow can generate many paths and dynamic URL variants. | Normalize paths and calculate breadth from grouped features or product areas. |
| Treating every feature as equally relevant | Specialized and role-specific accounts appear artificially shallow. | Build an eligible set for the plan, use case, role, lifecycle, and period. |
| Using page views as adoption | Navigation proves reach, not meaningful use or completion. | Define an area-specific qualifying action or workflow threshold. |
| Assuming broad usage is always better | Focused specialist use may be the intended outcome. | Interpret breadth against the customer’s actual job and product design. |
| Assuming deep usage is always valuable | High volume can include retries, loops, or inefficient work. | Pair intensity with completion, outputs, efficiency, and selected session evidence. |
| Rewarding friction through time spent | More time may mean the workflow is harder than necessary. | Treat engaged time as an attention signal, not standalone proof of value. |
| Ignoring role specialization | The correct specialist can deeply adopt a workflow with low user penetration. | Use role-appropriate eligibility and inspect role coverage. |
| Letting one power user represent the account | Healthy totals can conceal champion dependency. | Show contributing users, top-user concentration, and backup coverage. |
| Comparing onboarding accounts with mature accounts | Lifecycle changes what is available and what use is expected. | Compare accounts at relevant stages and use lifecycle-specific expectations. |
| Using too short a period | Low-frequency workflows may disappear even though they remain adopted. | Match the window to expected cadence and inspect several periods. |
| Combining breadth and depth into an opaque score | Equal scores can hide very different behavior. | Keep components visible and explain any weighting. |
| Changing feature groupings without preserving history | A taxonomy change can create a false adoption trend. | Version mappings, backfill where defensible, or mark a clear series break. |
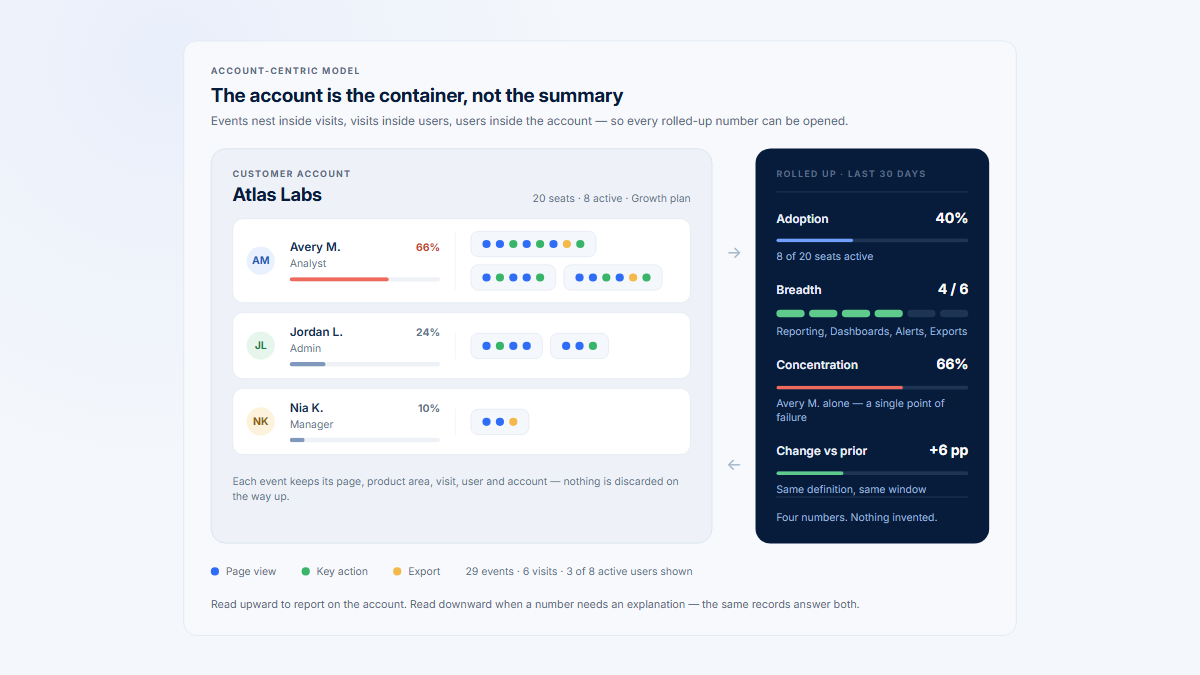
How Hymetry shows product adoption across an account
Hymetry uses product structure and account context to keep breadth, user distribution, and session evidence connected.
In Hymetry terminology:
- a product area is a high-level part of the product;
- a grouped page or feature is the primary analytical level for adoption, engagement, company comparison, and user comparison;
- a normalized raw page preserves exact path and action evidence.
The Pages area can show product-area and grouped-page usage across companies, users, adoption, penetration, Visits, engaged behavior, interaction, and trends. The Companies area places adoption breadth beside active users, product usage, recent movement, and account context. Users shows which people and roles create the account-level pattern. Visits provides the session-level evidence layer when a metric needs closer inspection.
A practical investigation path
Company breadth
→ Product area
→ Contributing users
→ Relevant Visits
For example, a team may begin with a company that adopted four product areas, open one area to see which grouped capabilities qualify, inspect the users contributing to that usage, and then review selected Visits where completion or friction needs explanation.
Hymetry should not present broad usage as automatic proof of a healthier account. Broad usage can still depend on one champion. Narrow usage can be appropriate for a specialist workflow. Engaged time can reflect productive work or unnecessary effort. The surrounding evidence remains necessary.
For broader context, read the verified guides on B2B product analytics and measuring product usage by company. Product teams can also review the product-team use case, while customer-success teams can review the customer-success use case.
Frequently asked questions
What is product adoption breadth?
Product adoption breadth is the count or share of relevant product areas, features, or workflows that meet a documented adoption threshold. Always state the entity, eligible set, qualifying behavior, and period.
What is product adoption depth?
Product adoption depth describes how meaningfully an adopted capability is used. It may include meaningful-action volume, active days, recurrence, workflow completion, output creation, or other product-appropriate signals. There is no universal depth formula.
Is frequency part of adoption depth?
It can be. Some frameworks include frequency or recurrence within depth, while others keep it separate. Keeping frequency visible often makes bursty use easier to distinguish from a recurring workflow.
Is low adoption breadth bad?
Not automatically. Low breadth can reflect a focused use case, a specialist-owned workflow, early onboarding, a low-frequency product, or incorrect eligibility assumptions. Interpret it against intended use and lifecycle.
Can one specialist represent deep account adoption?
A specialist can deeply adopt a role-specific workflow even when user penetration is low. The account may still need backup coverage if the workflow is operationally important.
Should breadth and depth be combined into one score?
Only when there is a clear decision that requires a summary and every component and weight remains inspectable. For most investigations, showing breadth, depth components, user distribution, and concentration separately is more informative.
How long should the measurement period be?
Use a period long enough to observe the expected cadence of the relevant workflows. Daily tools may support weekly or monthly analysis. Monthly, quarterly, or one-time workflows need longer windows or lifecycle-aware rules.
Sources
The sources below do not share one universal definition of breadth and depth. They are included to make the terminology differences and measurement principles traceable.
- Kerry Rodden, Hilary Hutchinson, and Xin Fu — Measuring the User Experience on a Large Scale: User-Centered Metrics for Web Applications: https://research.google.com/pubs/archive/36299.pdf
- Amplitude — How-To Guide: Running Your North Star Workshop: https://info.amplitude.com/rs/138-CDN-550/images/North-Star_how-to-Guide_2024.pdf
- Amplitude — The North Star Playbook: https://info.amplitude.com/rs/138-CDN-550/images/Amplitude-The-North-Star-Playbook.pdf
- Pendo — What Is Feature Adoption?: https://www.pendo.io/glossary/feature-adoption/
- Pendo — Three KPIs All PMs Should Know How to Measure: https://www.pendo.io/pendo-blog/three-kpis-all-pms-should-know-how-to-measure/
- Gainsight — The Product Adoption Data That Customer Success Needs: https://www.gainsight.com/blog/the-product-adoption-data-that-customer-success-needs/
- Gainsight — How Gainsight Redesigned the Customer Health Score for One of Its Products: https://www.gainsight.com/blog/how-gainsight-redesigned-the-customer-health-score-for-one-of-its-product/
- PostHog — Group Analytics: https://posthog.com/docs/product-analytics/group-analytics
- Hymetry — Pages Analytics: https://www.hymetry.com/product/pages/
- Hymetry — Companies: Account Intelligence: https://www.hymetry.com/product/companies/
- Hymetry — User Intelligence for B2B SaaS: https://www.hymetry.com/product/users/
- Hymetry — Session Visits & Replay: https://www.hymetry.com/product/visits/