Why analytics terms differ
There is no universal product analytics session definition. Vendors frequently use the same words for different calculations—or different words for similar calculations.
A 30-minute inactivity timeout is a common default, but it is not a standard that every product must adopt. Some systems support timeout-based sessions. Others can use explicit start and end events, a supplied session ID, campaign changes, calendar-day boundaries, or additional product-specific rules. Page views may be produced by full document loads, browser-history changes, application events, or manual tracking calls. Engaged time may use visibility, focus, interaction events, heartbeats, capped gaps, or a combination.
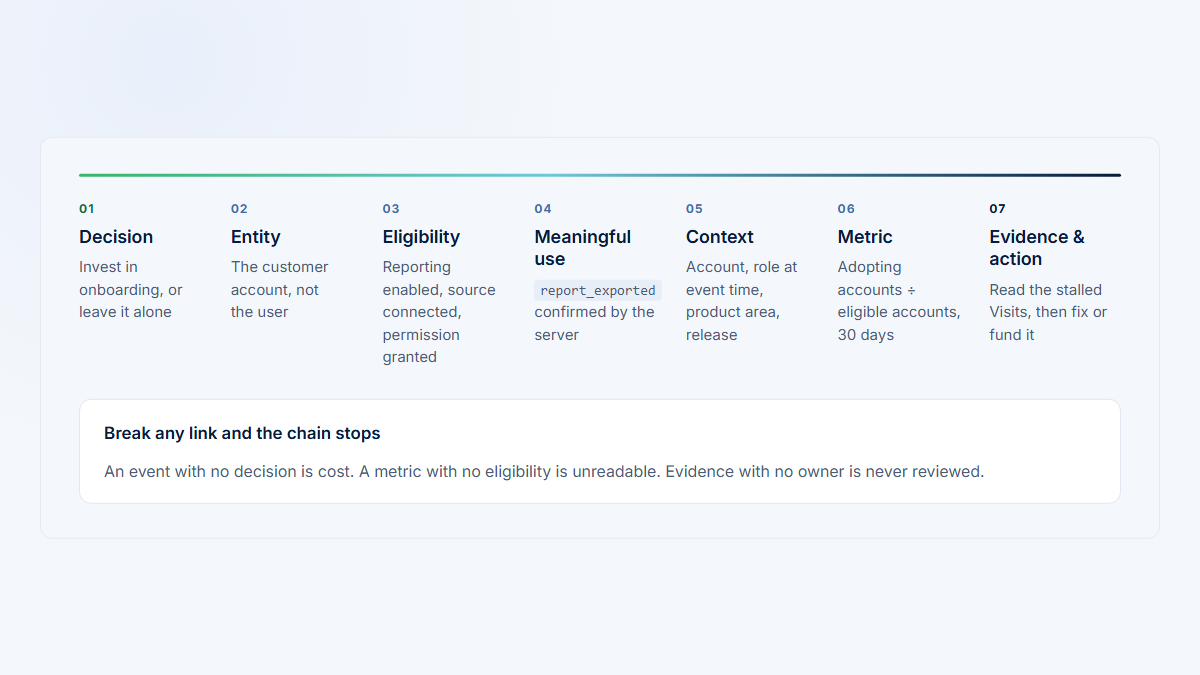
This is why a team should define its metrics in the same place it defines its product analytics instrumentation plan.
At minimum, document these decisions:
| Decision | Question to answer |
|---|---|
| Event trigger | What exact observed action or occurrence creates the event? |
| Session boundary | What starts a session, and what forces a new one? |
| Inactivity timeout | How long can the gap between qualifying events be? |
| Navigation handling | Do full loads, refreshes, History API changes, redirects, and repeated routes create page views? |
| Foreground and background behavior | Can time or events accrue while the document is hidden? |
| Multiple-tab behavior | Are simultaneous tabs merged into one session, separated, or ordered using a tab identifier? |
| Identity | Is the actor identified by an authenticated user ID, anonymous ID, device, browser, company, or stitched identity? |
| Engaged-time method | Which events, heartbeats, visibility states, focus states, and event-gap caps qualify? |
| Period deduplication | How are users, companies, sessions, or pages deduplicated across the full selected period? |
| Timezone and period boundaries | Which timezone defines days, and are start and end timestamps inclusive or exclusive? |
A comparison is defensible only when these rules are comparable. Matching labels are not enough.
Event or action
An event is a timestamped observed action or system occurrence.
Examples include:
- page viewed;
- button clicked;
- form submitted;
- report exported;
- integration connected.
Events are raw facts used to construct higher-level measurements. A page view is usually an event. A session is usually derived from several events. Engaged time is usually calculated from event timestamps plus additional eligibility rules.
Not every event proves direct user activity. An integration sync, background notification, automatic refresh, server-side billing update, or support-team action may be a legitimate event without representing customer product use. The event taxonomy should distinguish user-initiated behavior from system occurrences before either is used to keep a session alive or qualify an active user.
Event timestamp rules matter too. Delayed delivery, offline queues, retries, clock differences, or batch ingestion can affect event order unless the system distinguishes the time an action occurred from the time it was received.
Page view
A page view records that a page, route, screen, or equivalent product surface was viewed according to the tracking implementation.
In a traditional multi-page application, a page view commonly occurs when the browser loads a new document. A refresh may therefore produce another page view. Returning with the browser’s Back button may produce another view, depending on the browser lifecycle and tracking setup.
In a single-page application, navigation can replace the visible product screen without loading a new document. The application may update the URL with the History API, render a new route, or change an internal screen state. Accurate SPA analytics therefore needs an explicit rule for when a route or virtual screen becomes a page view.
Automatic and manual tracking can also overlap. For example, an implementation that listens to browser-history changes and separately sends a manual page-view event for the same route can double-count the navigation.
A defensible page-view definition should say whether it includes:
- initial document loads;
- refreshes;
- browser Back and Forward navigation;
pushState,replaceState, and related History API changes;- hash or fragment changes;
- redirects;
- modal or drawer states;
- repeated navigation to the same normalized route;
- automatic and manual events;
- deduplication within a short interval.
Normalize dynamic URLs before treating them as product pages
Record-specific URLs should not automatically become separate product features.
For example:
/reports/451
/reports/883may both become:
Grouped page: Report details
Normalized raw page: /reports/:report_id
Product area: ReportingThe two navigations can still be two page views. They simply roll up to the same normalized raw page and grouped page.
The common hierarchy is:
Raw URL → normalized page → grouped page → product areaThis separates exact navigation evidence from feature-level analysis. It prevents thousands of record IDs, workspace IDs, query parameters, or optional path variants from fragmenting one meaningful workflow.
A page view is also not automatically a meaningful product action. Viewing a report is different from applying a filter, exporting it, sharing it, or using its result in another workflow. Page views measure reach and movement; business events measure what was accomplished.
Page visit or page-level stay
A page-level visit, also called a page stay or page segment, is a continuous segment of a broader session during which the user remains on one normalized or grouped page.
A page-level visit can begin when:
- a tracked page view occurs;
- a route changes;
- the normalized page changes;
- a new page-level segment is explicitly started.
It can end when:
- another page or route begins;
- the session ends;
- the page is closed or hidden under the chosen rule;
- the measurement reaches an explicit or inferred boundary.
A session can contain several page-level visits. The same grouped page can appear more than once in one session—for example, when a user opens Report details, moves to Settings, and then returns to Report details.
This page-level concept is distinct from a complete product session. In Hymetry, the main Visits product area refers to session-level Visits. Do not confuse that navigation label with page-level visit aggregates used in page analytics.
Visit or session
A session is a sequence of related product activity from one user or actor. It is usually separated from another session by an inactivity threshold or an explicit boundary.
In Hymetry’s user-facing language, that session is a Visit.
Possible boundaries include:
| Boundary | Effect |
|---|---|
| Inactivity timeout | Start a new session when the gap after the last qualifying event exceeds a threshold. |
| Explicit logout | End the current authenticated product session. |
| Browser or app closure | End or infer an endpoint when the product can observe it reliably. |
| Calendar-day boundary | Split activity at midnight in the configured reporting timezone. |
| Authentication boundary | Start a new session when the identified actor changes. |
| Campaign or referrer change | Start a new acquisition session when attribution changes. |
| Explicit start or end event | Use product events such as login, logout, app_open, or workflow_complete. |
| Supplied session ID | Group events that carry the same trusted session identifier. |
| Application-specific rule | Split sessions around environments, workspaces, devices, modes, or business workflows. |
Why 30 minutes is common—but not universally correct
Thirty minutes of inactivity is a common analytics default. It is familiar, easy to communicate, and often separates ordinary browsing sequences reasonably well. It is still only a rule.
A B2B workflow can include long periods of reading, data review, meetings, switching to another tool, waiting for an export, or preparing material outside the browser. A 30-minute threshold may split one real-world task into multiple analytical sessions. A much longer threshold may do the opposite: it may merge unrelated work because a background event or open tab keeps the sequence alive.
Choose a threshold from the product’s workflows and measurement purpose. Then keep the definition visible whenever session counts or average session duration are reported.
The same events can produce one session or two
Consider this fictional event stream:
09:00 Page view: Dashboard
09:04 Click: Open report
09:05 Page view: Report details
09:11 Export report
09:48 Page view: SettingsThe gap between the export at 09:11 and the Settings page view at 09:48 is 37 minutes.
With a 30-minute inactivity threshold:
Visit 1: 09:00–09:11
Visit 2: begins at 09:48With a 45-minute or 60-minute inactivity threshold:
Visit 1: 09:00–09:48The event data is identical. The session count changes because the sessionization rule changes.
Elapsed session duration
Elapsed session duration is the clock time between the selected session start and end timestamps.
A simple version is:
Elapsed session duration
Elapsed session duration =
selected session end timestamp
− selected session start timestamp
The difficulty is not subtraction. It is choosing the boundaries.
The last-event problem
Suppose the final recorded action occurs at 09:11. The analytics system does not automatically know whether the user:
- closed the tab immediately;
- continued reading until 09:12;
- left the tab open until 09:30;
- switched to another application;
- lost network connectivity;
- continued working without producing another tracked event.
If duration is defined as the timestamp of the last event minus the timestamp of the first event, the last page’s unobserved time is omitted. This can undercount a session in which the user continued reading or working.
The same calculation can overstate active use when a long inactive gap occurs between two events. A user might click at 09:00, leave the tab untouched, and return at 09:25. First-to-last elapsed duration would include the whole interval even though continuous activity was not observed.
An explicit page-leave or session-end event can add evidence, but browser lifecycle events are not guaranteed to arrive in every closure, crash, sleep, navigation, or network-loss case. Duration should therefore be labeled as an analytical calculation, not exact human attention.
Time on page
Time on page estimates how long a page-level visit lasted. Several methods are common.
| Method | Basic calculation | Main limitation |
|---|---|---|
| Next-page timestamp | Next page view minus current page view | The final page has no next page. |
| Explicit page-leave event | Leave timestamp minus page-entry timestamp | Leave events may be lost or never emitted. |
| Heartbeat or activity ping | Accumulate time confirmed by periodic signals | Ping intervals, throttling, and background behavior affect the result. |
| Visibility and focus signals | Count intervals when the page is eligible, visible, or focused | Visible or focused does not prove attention. |
| Capped event gaps | Add the interval to the next qualifying event up to a maximum cap | The selected cap changes the result and may miss quiet work. |
| Combined method | Use interaction, visibility, heartbeats, and caps together | More defensible, but more complex to explain and reproduce. |
Common limitations include:
- Final page: there is no later page timestamp from which to infer its end.
- Background tabs: the document may remain open while the user works elsewhere.
- Multiple tabs: events can interleave, and more than one tab may report the same identity.
- System sleep: wall-clock gaps can expand while no product work occurs.
- Batched or delayed events: receipt order may differ from action order.
- Navigation without unload: modern browser navigation does not guarantee a dependable unload signal.
- Network loss: a final leave event or heartbeat may never reach the server.
- Automatic refresh: a system-generated event may look like continued activity.
- Passive reading: useful work may happen without clicks or form events.
For these reasons, “time on page” is incomplete unless the implementation method is part of the definition.
Engaged time
Engaged time is an estimate of observed active product usage rather than total elapsed clock time.
Implementations may use:
- clicks, typing, scrolling, or other interaction events;
- foreground or background state;
- document visibility;
- window focus;
- activity heartbeats;
- capped gaps between qualifying events;
- application lifecycle signals;
- combinations of these methods.
One possible calculation is:
Observed engaged time
Observed engaged time =
sum of min(
time until the next qualifying activity,
activity cap
)
while the page is eligible and active
This formula is illustrative. It is not a universal standard, and it is not a statement of Hymetry’s exact implementation.
Under this method, an event can start a short period of eligible time. If another qualifying event arrives before the cap, the observed interval is included. If the gap exceeds the cap, only the capped interval is included. Hidden or otherwise ineligible periods are excluded.
A different implementation might use periodic heartbeats, explicit interaction windows, focus state, or a tracker-generated active-time value instead. The result can change substantially even when the raw clicks and page views remain the same.
Engaged time is not attention or value
Observed active time is useful because it separates some active intervals from obvious inactivity. It remains ambiguous.
Longer engaged time can represent:
- deep work;
- careful reading;
- a complex workflow;
- waiting for the product;
- confusion;
- repeated correction;
- passive monitoring;
- leaving a dashboard visible;
- automation that still produces qualifying events.
Shorter engaged time can represent either abandonment or an efficient workflow.
Do not interpret longer engaged time as automatically better. Pair it with outcomes, interaction quality, workflow completion, account context, and—where appropriate—session evidence.
Active user and active company
An active user is a distinct user identity with at least one qualifying Visit or event during the selected period.
An active company is a distinct company identity with at least one qualifying Visit or event during the selected period.
The word qualifying is essential. A team should specify whether activity includes or excludes:
- authenticated customer activity;
- anonymous or unidentified activity;
- background refreshes;
- integration and API events;
- automated jobs;
- support access;
- employee or internal activity;
- test accounts;
- bots;
- duplicate or retried events;
- invalid or incomplete identity data.
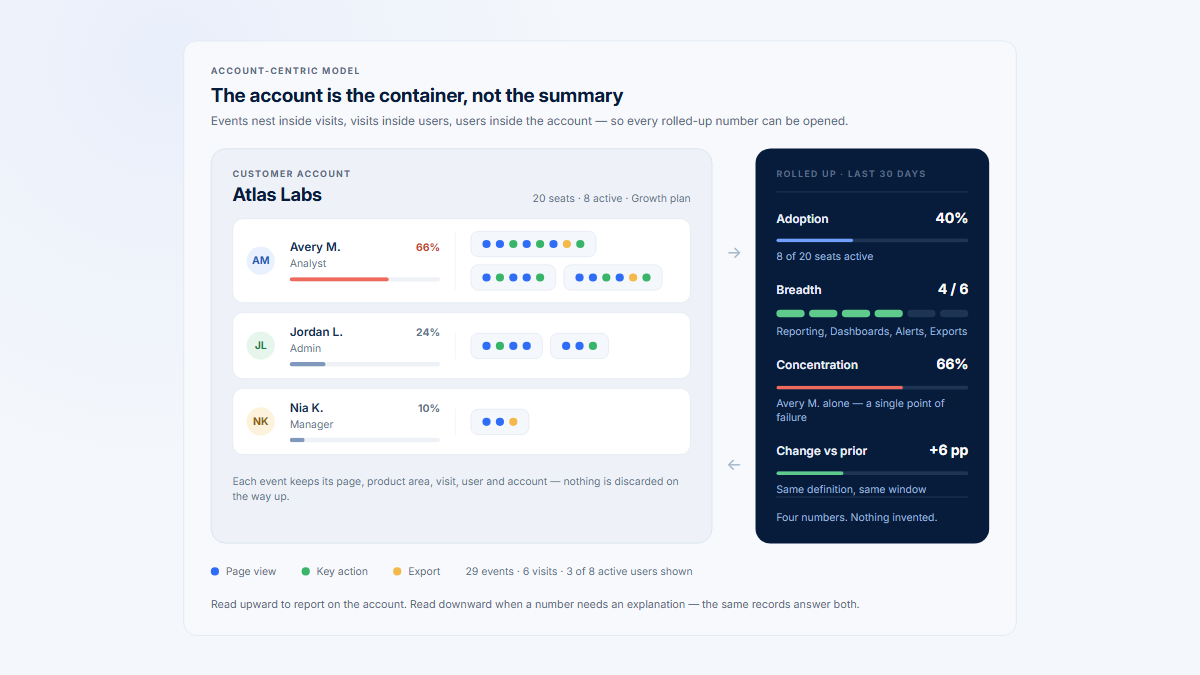
For B2B analysis, company identity is as important as user identity. A page can have many users but only a few customer accounts, or broad account reach with activity concentrated in one champion per account. See B2B product analytics and product usage by company for the account-level implications.
Do not sum daily unique counts
The same identity can appear on several days.
For example:
Day 1 users: A, B, C = 3 daily users
Day 2 users: B, C, D = 3 daily usersThe sum of the daily values is six:
3 + 3 = 6But the distinct users across the complete period are:
A, B, C, D = 4 period usersThe correct formulas are:
Period active users
Period active users =
count of distinct user IDs
across the complete selected period
and:
Period active companies
Period active companies =
count of distinct company IDs
across the complete selected period
Daily distinct values remain useful for a time-series chart. They answer, “How many distinct identities were active on each day?” The selected-period total answers a different question: “How many distinct identities were active at least once anywhere in this period?”
Distinct counts are non-additive across overlapping groups or time buckets. This applies to users, companies, devices, pages used, and any other metric defined with period-level deduplication.
Visits, page views, and users describe different levels
A single person can create many events, several page views, and multiple Visits on one active day.
For example:
| Measurement | Fictional result | What it describes |
|---|---|---|
| Events | 18 | Individual observed actions and system occurrences |
| Page views | 5 | Tracked page or route views |
| Page-level visits | 5 | Continuous page segments under the chosen page rule |
| Visits or sessions | 2 | Related activity sequences under the session rule |
| Active users | 1 | One distinct qualifying user |
| Active companies | 1 | One distinct qualifying customer account |
| Active days | 1 | One calendar day containing qualifying activity |
None of these totals is a substitute for another. They describe different analytical levels.
Page interaction rate
A possible page interaction rate is:
Page interaction rate
Page interaction rate =
page-level visits with at least one qualifying interaction
÷ total page-level visits
× 100
The interaction definition must be explicit.
A click on a primary workflow control may be meaningful. A click used only to close a notification may not be. Mouse movement, hover, focus, or a pointer entering the page is not automatically equivalent to deliberate product interaction.
If the rule changes from “at least one click” to “at least one click, form submission, or keyboard action,” the rate changes. Keep the definition versioned with the metric.
Average duration is not one metric
The phrase average session duration is incomplete unless the base duration is named.
Possible averages include:
Average elapsed duration per Visit
Average elapsed duration per Visit =
total elapsed Visit duration
÷ number of Visits
Average engaged time per Visit
Average engaged time per Visit =
total observed engaged time
÷ number of Visits
Average engaged time per user
Average engaged time per user =
total observed engaged time
÷ distinct active users
These averages can answer different questions and have different denominators.
An average can also be distorted by:
- a few very long Visits;
- one power user;
- many zero- or near-zero-duration sessions;
- background activity;
- unequal company sizes;
- internal or automated events;
- changes in the session timeout;
- missing endpoints.
A median, percentile, or distribution can help show whether the average represents a typical Visit. Median is not always superior: for sparse data or mixed workflow types, a distribution split by segment may be more informative than any single center value.
Worked example: one user, two Visits, five page views
The following timeline is fictional. It demonstrates how raw events become page views, grouped pages, page-level stays, Visits, elapsed duration, and illustrative engaged time.
Assumptions
For this example only:
- the inactivity threshold is 30 minutes;
- each tracked page-view event begins a new page-level stay;
- a page view occurs for each tracked route navigation, including navigation between two record-specific report URLs;
/reports/451and/reports/883both normalize to/reports/:report_id;- both normalized report URLs belong to the grouped page Report details;
- qualifying engaged-time activity includes page views, clicks, and form submissions;
- the
export_completedsystem event is recorded but does not by itself qualify as user activity; - visibility events define foreground eligibility but do not themselves start an engagement interval;
- time is counted only while the document is visible;
- each qualifying event gap is capped at two minutes;
- a final interval can run from the last qualifying event to the next hidden event, subject to the cap;
- visibility events are retained as analytical events and may serve as elapsed-duration endpoints;
- the reporting timezone is fixed and the complete example occurs on one calendar day;
- the identified user belongs to one identified company.
Timeline
| Time | Captured event | Normalized or grouped page | Visibility | Engaged-time treatment |
|---|---|---|---|---|
| 09:00:00 | Page view: /dashboard | Dashboard | Visible | Qualifying activity |
| 09:00:30 | Click: Open report | Dashboard | Visible | Qualifying activity |
| 09:00:35 | Page view: /reports/451 | /reports/:report_id → Report details | Visible | Qualifying activity |
| 09:01:20 | Click: Filter | Report details | Visible | Qualifying activity |
| 09:02:00 | Form submit: Apply filter | Report details | Visible | Qualifying activity |
| 09:04:00 | Visibility: hidden | Report details | Hidden | Stop eligible interval |
| 09:09:00 | Visibility: visible | Report details | Visible | Eligibility resumes; no time yet |
| 09:09:20 | Click: Export report | Report details | Visible | Qualifying activity |
| 09:09:30 | System event: export completed | Report details | Visible | Recorded, not qualifying |
| 09:10:00 | Page view: /reports/883 | /reports/:report_id → Report details | Visible | Qualifying activity; new page stay |
| 09:10:45 | Click: Open comments | Report details | Visible | Qualifying activity |
| 09:12:00 | Page view: /settings/integrations | Integration settings | Visible | Qualifying activity |
| 09:12:40 | Click: Connect integration | Integration settings | Visible | Qualifying activity |
| 09:13:00 | Visibility: hidden | Integration settings | Hidden | Stop eligible interval |
| 09:48:00 | Page view: /settings/profile | Profile settings | Visible | Qualifying activity; new Visit |
| 09:49:00 | Click: Timezone field | Profile settings | Visible | Qualifying activity |
| 09:50:00 | Form submit: Save settings | Profile settings | Visible | Qualifying activity |
| 09:51:00 | Visibility: hidden | Profile settings | Hidden | Stop eligible interval |
Event and page counts
The example contains:
Captured events: 18
Page views: 5
Page-level stays: 5
Distinct normalized raw pages: 4
Distinct grouped pages: 4
Active users: 1
Active companies: 1
Active days: 1The five page views are:
- Dashboard
- Report details for report 451
- Report details for report 883
- Integration settings
- Profile settings
The two report URLs produce separate page views and page-level stays, but both roll up to one normalized raw page and one grouped page.
Sessionization
The gap from the hidden event at 09:13 to the next page view at 09:48 is 35 minutes.
With the 30-minute threshold:
Visit 1: 09:00:00–09:13:00
Visit 2: 09:48:00–09:51:00Therefore:
Visits: 2Elapsed duration
Visit 1:
09:13:00 − 09:00:00 = 13 minutesVisit 2:
09:51:00 − 09:48:00 = 3 minutesTotal elapsed Visit duration:
13 minutes + 3 minutes = 16 minutesAverage elapsed duration per Visit:
16 minutes ÷ 2 Visits = 8 minutesThis elapsed total includes eligible and ineligible gaps inside each Visit. It is not a claim of 16 minutes of attention.
Illustrative observed engaged time
Under the two-minute cap and foreground requirement, the included intervals are:
00:30
+ 00:05
+ 00:45
+ 00:40
+ 02:00
+ 00:40
+ 00:45
+ 01:15
+ 00:40
+ 00:20
+ 01:00
+ 01:00
+ 01:00
= 10:40The hidden interval from 09:04 to 09:09 is excluded. The long gap from 09:13 to 09:48 is excluded. The system-generated export-completed event is recorded but does not create a separate qualifying interval.
Observed engaged time by page-level stay is:
| Page-level stay | Illustrative engaged time |
|---|---|
| Dashboard | 00:35 |
| Report details: report 451 | 04:05 |
| Report details: report 883 | 02:00 |
| Integration settings | 01:00 |
| Profile settings | 03:00 |
| Total | 10:40 |
At the grouped-page level, the two Report details stays combine:
Report details engaged time =
04:05 + 02:00 = 06:05Observed engaged time by Visit is:
Visit 1: 07:40
Visit 2: 03:00Average engaged time per Visit is:
10:40 ÷ 2 = 05:20Average engaged time per user is:
10:40 ÷ 1 user = 10:40Change one assumption, change the metric
Now change only the inactivity threshold from 30 minutes to 60 minutes.
The 35-minute gap no longer starts a new Visit:
Visits: 1
Elapsed Visit duration:
09:51:00 − 09:00:00 = 51 minutesThe event count remains 18. Page views remain five. The active-user and active-company counts remain one. The illustrative observed engaged time remains 10:40 because its foreground and event-gap rules did not change.
But these values change:
| Metric | 30-minute timeout | 60-minute timeout |
|---|---|---|
| Visits | 2 | 1 |
| Total elapsed Visit duration | 16:00 | 51:00 |
| Average elapsed duration per Visit | 08:00 | 51:00 |
| Average engaged time per Visit | 05:20 | 10:40 |
Changing the session boundary changed the session count and duration metrics without changing the underlying behavior.
Changing the engagement cap would alter a different set of metrics. With a one-minute cap instead of two minutes, the same timeline would produce 09:25 of illustrative engaged time rather than 10:40.
Common mistakes
| Mistake | Why it fails | Better practice |
|---|---|---|
| Treating Visits and page views as synonyms | One session can contain many page views. | Define and report each analytical level separately. |
| Assuming session rules are universal | Timeouts and explicit boundaries vary across tools and implementations. | Publish the exact sessionization rule. |
| Treating first-to-last-event duration as exact attention | It can omit final-page activity and include idle gaps. | Label it as elapsed analytical duration and pair it with active-time evidence. |
| Treating engaged time as value | Long time may reflect depth, waiting, confusion, or inefficiency. | Interpret it with outcomes and workflow context. |
| Summing daily unique counts | The same identity appears in multiple daily buckets. | Deduplicate over the complete selected period. |
| Ignoring SPA route changes | Several product screens may appear as one page. | Track intended virtual page views and test browser-history behavior. |
| Counting every dynamic URL as a different feature | Record IDs fragment one workflow into thousands of pages. | Normalize raw URLs and group them into meaningful pages. |
| Treating background tabs as active use | An open document may not be visible or used. | Document visibility and foreground eligibility rules. |
| Using mouse movement as proof of meaningful engagement | Movement can be accidental, automated, or unrelated to a product action. | Define qualifying interactions deliberately. |
| Comparing tools without comparing definitions | Similar labels can use different boundaries, identities, and denominators. | Compare the calculation contract, not just the metric name. |
| Changing the timeout but preserving the same historical label | The meaning of a “session” changes across the series. | Version the definition or recompute comparable history. |
| Failing to state timezone and period boundaries | Midnight splits and inclusive endpoints can change daily and period totals. | Display the reporting timezone and precise date boundaries. |
How Hymetry connects Pages and Visits
The definitions above are general analytics concepts. The following distinctions are Hymetry-specific and must remain aligned with current product documentation.
Product structure
Hymetry organizes page behavior through this hierarchy:
Raw URL → normalized page → grouped page → product areaA normalized raw page preserves exact path-level evidence without treating every dynamic identifier as a feature. A grouped page represents a meaningful page, feature, or workflow. A product area provides a higher-level product structure.
The Pages area uses grouped pages for adoption, company reach, users, page-level visits, engaged time, interaction, trends, and flows. Raw normalized pages remain available when exact action evidence is needed.
Visits are product sessions
In Hymetry’s main product navigation, a Visit is a user session. The Visits area connects the identified user and company with the ordered page path, timing, events, observed active-time distribution, and available session evidence.
A page visit remains a page-level segment inside the Visit. This distinction matters when a Pages table reports page-level visit counts while the Visits section lists complete product sessions.
Account and user identity
Hymetry connects behavior to both an individual user and a customer company when valid identity is available. This allows a page signal to be investigated through the Companies and Users views rather than interpreted only as global traffic.
An active company or active user should be based on qualifying product activity under the maintained Hymetry definition. Background, unidentified, internal, or otherwise invalid activity should not be described as customer adoption unless current documentation says it qualifies.
Elapsed duration and observed active time
Hymetry’s current public Visits interface distinguishes:
- elapsed analytical duration from the first observed event to the last, including inactive periods;
- observed active time distributed across pages, excluding inactivity.
The maintained repository documentation must remain the final authority for the exact calculation. Do not infer an undocumented heartbeat frequency, event-gap cap, focus rule, visibility rule, or tracker behavior.
Observed active time is evidence of measured product activity. It is not perfect measurement of attention.
From aggregate signal to session evidence
Hymetry’s investigation path connects the analytical levels:
- Pages identify a page, feature, or product-area signal.
- Companies show which accounts are affected.
- Users show the people behind the account pattern.
- Visits provide the session-level path, timing, and replay evidence where deeper review is useful.
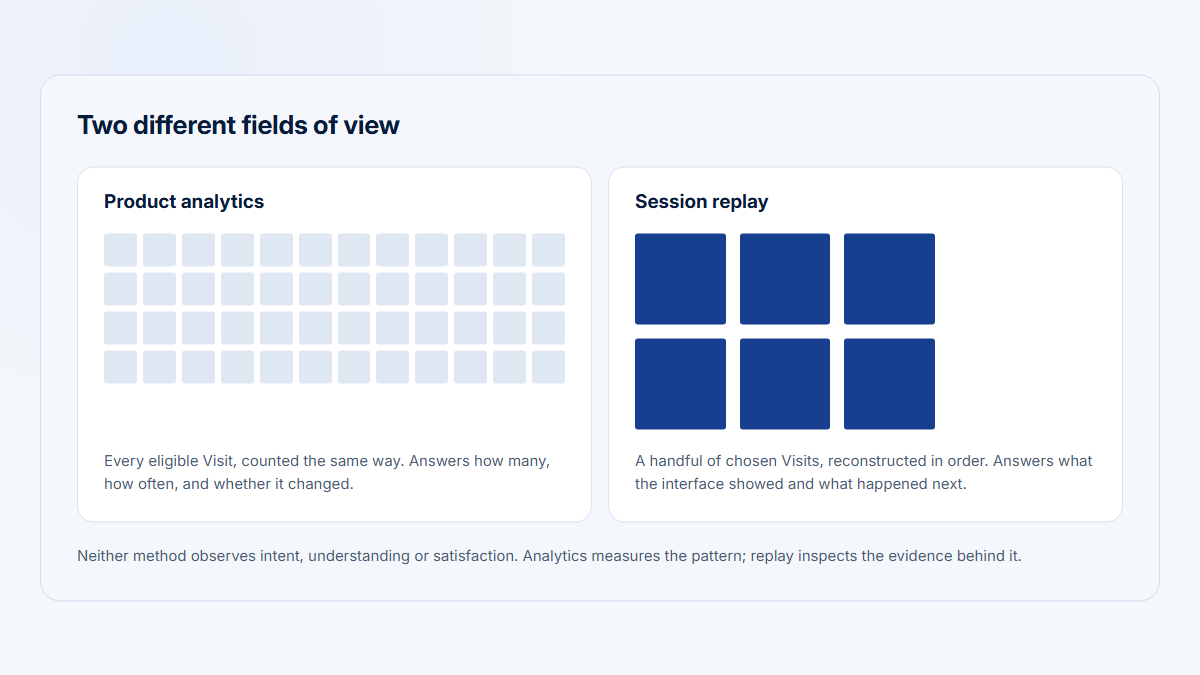
The purpose is not to watch every recording. It is to use page, company, and user context to find the relevant Visit, then inspect the evidence before drawing a conclusion.
Frequently asked questions
What is the difference between page views and sessions?
A page view records a tracked page or route view. A session groups related activity from one user under a sessionization rule. One session can contain one page view or many page views.
Are visits and sessions the same?
They can be, but the terminology is product-specific. Some analytics tools use “visit” as a synonym for session. In Hymetry, a capitalized Visit is the user-facing term for a product session. A page visit is a smaller page-level segment inside that Visit.
What is the difference between session duration and engaged time?
Session duration is elapsed clock time between selected session boundaries. Engaged time estimates observed active use under additional rules such as interaction, foreground visibility, heartbeats, or capped event gaps. Engaged time is normally less than or equal to elapsed duration, but the exact relationship depends on the implementation.
How is time on page calculated?
Common methods include subtracting the current page-view timestamp from the next page-view timestamp, recording an explicit leave event, sending heartbeats, observing visibility or focus, or capping the gaps between qualifying events. Every method has limitations, especially on the final page.
Why can two analytics tools report different session counts?
They may use different inactivity timeouts, calendar boundaries, campaign rules, identity stitching, excluded events, multiple-tab behavior, or supplied session IDs. The raw events can be the same while the derived sessions differ.
Is a 30-minute session timeout correct?
It is a common default, not a universal truth. The appropriate threshold depends on the product’s workflows and the purpose of the analysis. Long B2B workflows may need a different rule, but extending the threshold can also merge unrelated activity.
Can I add daily active users to calculate monthly active users?
No. The same user can be active on several days. Count distinct user IDs across the complete month. Daily active-user values remain useful for a daily trend chart.
Does higher engaged time mean better engagement?
Not automatically. Higher observed active time can mean valuable deep work, but it can also indicate complexity, waiting, confusion, repeated correction, or passive monitoring. Interpret it with workflow outcomes and qualitative evidence.
Sources
- Hymetry — Pages Analytics
- Hymetry — Session Visits & Replay
- Hymetry demo — Pages
- Hymetry demo — Visits
- Google Analytics — Measure pageviews
- Google Analytics — Measure single-page applications
- Google Analytics Help — About Analytics sessions
- Google Analytics Help — User engagement
- WHATWG HTML Standard — Page visibility
- MDN Web Docs — Page Visibility API
- MDN Web Docs — Document: visibilitychange event
- MDN Web Docs — History: pushState() method
- Mixpanel — Sessions: Compute sessions based on existing event data
- Amplitude — Track sessions
- Matomo — How is a ‘Visit’ defined in Matomo?
- Matomo — How do I improve accuracy of “Time spent on page” and “Visit duration” metrics?
- Matomo — How do I add a JavaScript heartbeat timer to measure time spent on page, including the last page of their visit?
- Adobe Analytics — Page Views
- Adobe Analytics — Visits
- Adobe Analytics — How Time Spent is calculated in Adobe Analytics
- Adobe Analytics — Unique visitors