Menu
Session evidence and privacy

Session Replay vs Product Analytics: When to Use Each

Learn which questions product analytics and session replay answer, where each method can mislead, and how to combine them in a focused product investigation.

Product analytics and session replay answer different questions. Product analytics measures patterns across users, companies, product areas, workflows, and time: how often something happens, where behavior changes, and who contributes to the result. Session replay inspects the reconstructed sequence inside selected visits: what interface state appeared, which controls were used, and what visible context surrounded an abandonment, error, or successful completion.

Neither method reveals intent on its own. A replay can show a pause but not why the user paused. Analytics can show a drop but not whether a control rendered poorly or a message was misunderstood. In most product investigations, start with a measurable signal, identify the affected accounts and users, then compare relevant successful and unsuccessful sessions. That is more reliable than treating product analytics vs session recording as a choice between competing tools.

What product analytics measures

Product analytics is the structured analysis of behavioral data such as events, event properties, identified users, companies or other groups, pages or features, sessions, and time periods. Its purpose is to turn many individual actions into comparable measures.

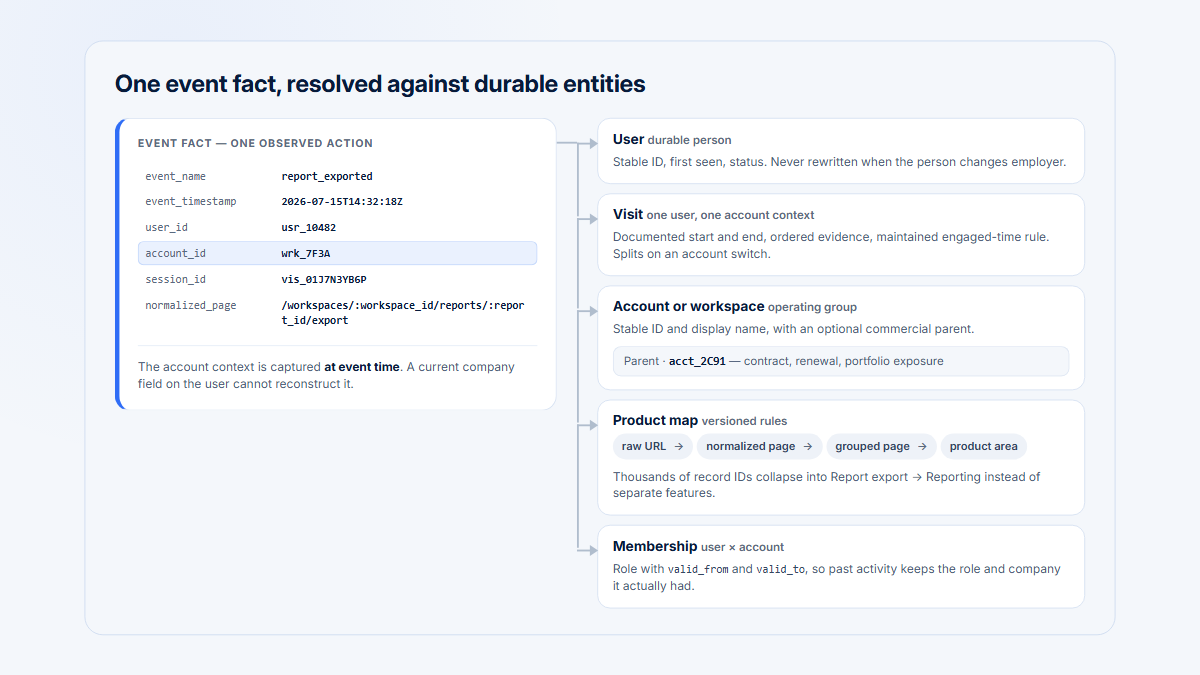
A product team might define an Export completed event, connect it to a user and company, and compare completion across roles, plans, onboarding stages, releases, or equal time periods. It might also group related URLs into a Reporting workflow and measure how many active companies reached it, how many users participated, and whether use broadened or declined.

This makes product analytics well suited to questions such as:

  • How many companies adopted Reporting?
  • Which product area declined compared with the previous period?
  • Which users stopped returning?
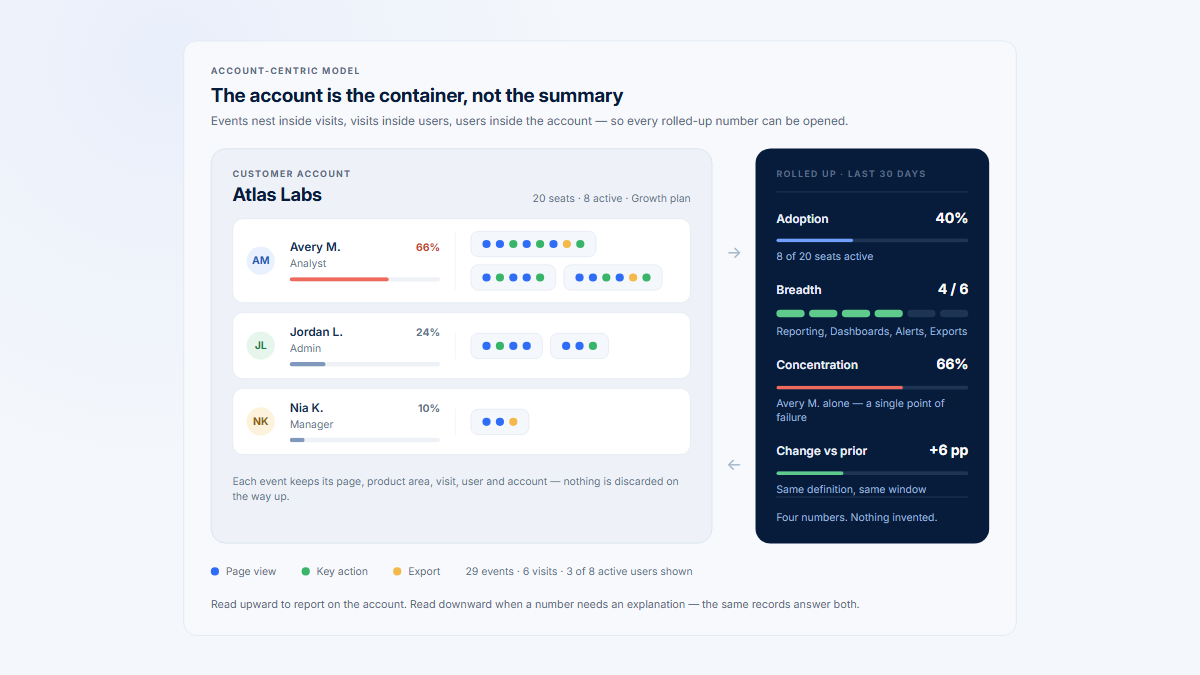
  • Is usage broad across an account or concentrated in one power user?
  • Did a release change completion across the measured population?
  • Which visits belong to the affected segment?

The strength of analytics is scale. It can summarize thousands of actions without asking a person to inspect every session. It can reveal where a meaningful difference exists and how large that difference is.

Its weakness is abstraction. An event name tells you that an instrumented action fired; it does not directly show the visual state around the action. A funnel can reveal that fewer users moved from export setup to export completion, but it may not show whether the primary control was hidden, the page rendered incorrectly, the copy was ambiguous, or an uninstrumented step intervened.

For a broader account-level framework, see B2B product analytics. For the distinction between a page view, page visit, session, Visit, duration, and engaged time, see Page views, visits, sessions, and engaged time.

What browser session replay shows

Session replay is a reconstruction of activity within a selected session. It lets a reviewer follow an ordered sequence of page states and interactions, often alongside a timeline, page path, timestamps, user context, and session metadata.

For browser applications, replay is commonly reconstructed rather than stored as a literal screen-recorded video. An rrweb-style implementation begins with a serialized snapshot of the page’s Document Object Model, records subsequent DOM mutations and timestamped interactions, and later rebuilds the initial state while applying the event stream in sequence. Depending on the implementation and configuration, that stream may include events such as clicks, pointer movement, scrolling, viewport changes, and input changes.

That distinction matters. A reconstructed replay is evidence produced by a capture system, not a perfect copy of human perception. Tools differ in how they handle assets, fonts, canvas content, iframes, shadow DOM, network data, input values, masking, blocked elements, sampling, and pages loaded before recording starts. A replay may therefore omit or reconstruct some details differently from the original screen. This article focuses on browser replay; native mobile replay can use different capture methods.

Session replay is useful for questions such as:

  • Which interface state appeared before the user abandoned the workflow?
  • Where in the selected visit did the user pause or change direction?
  • Was an important control visible in the reconstructed viewport?
  • Did the user repeatedly return from export settings to report setup?
  • What visible sequence occurred before an error?
  • How did successful and unsuccessful users navigate the same workflow?

Replay is strongest when the session was selected for a reason. A support case can identify a specific user and time. A product metric can identify a failed step and affected segment. An account signal can identify a company whose behavior changed. Without that selection logic, a replay library is simply a large set of anecdotes.

Individual replay review is usually qualitative, observational evidence. Replay metadata and derived events can be counted, but watching a handful of recordings cannot establish how prevalent a behavior is. That requires structured measurement across the relevant population.

Product analytics summarizes structured behavior across many companies, users, workflows, and time periods, while session replay reconstructs selected visits for closer inspection.
Product analytics measures the pattern; session replay helps inspect selected evidence behind it.

Product analytics versus session replay

The practical difference is not “numbers versus video.” It is population-level measurement versus close inspection of selected evidence.

DimensionProduct analyticsSession replay
Primary questionHow many, how often, which segment, which accounts, what changed, and compared with what?What sequence and interface state appeared in a selected visit?
Unit of analysisEvents, users, companies or groups, pages or features, sessions, cohorts, and time periodsOne visit or a deliberately selected set of visits
ScaleMany users, accounts, actions, and periodsClose inspection of a small, relevant sample
StrengthsFrequency, distribution, adoption, trends, segmentation, comparison, and prevalenceSequence, navigation, visible UI state, timing, and contextual evidence around a moment
LimitationsDepends on definitions and instrumentation; usually cannot show the rendered interface or explain motivationCannot establish representativeness, prevalence, or intent from a few sessions; reconstruction fidelity varies
Privacy considerationsEvent names, properties, identifiers, and payloads can contain personal or sensitive data and should be minimizedOn-screen text, inputs, page content, and detailed behavior create a larger exposure surface unless capture is masked, blocked, and governed
Suitable outputTrend, cohort, adoption measure, segment comparison, funnel, account list, or set of relevant session IDsAnnotated observation, visible sequence, comparison of session patterns, bug evidence, or a hypothesis to validate
Common misuseTreating a metric change as proof of causeTreating one dramatic replay as representative, or reading intent into pauses and clicks

Product analytics can tell you that export completion fell among onboarding accounts. Replay can help you inspect what the reconstructed interface showed in selected successful and unsuccessful visits from those accounts. Replay cannot tell you how common the pattern is unless you return to broader data, and analytics may reveal the drop without explaining the interface-level mechanism.

The useful way to frame quantitative vs qualitative product analytics is not as an absolute tool boundary. Structured product analytics is primarily quantitative because it measures defined populations and comparisons. Reviewing selected replays is primarily qualitative and observational. Session replay analytics can aggregate replay metadata or derived events, but prevalence still requires a clear denominator and a broader behavioral data model.

Questions neither method answers alone

Both methods are partial representations of behavior. Their limits should shape the conclusion you are willing to make.

What product analytics alone usually cannot show

Structured analytics usually cannot directly show:

  • what the user saw on screen;
  • whether an element appeared visually broken;
  • whether the user read or misunderstood text;
  • why the user paused;
  • whether repeated clicks represented frustration, impatience, uncertainty, or an intentional action;
  • the user’s motivation.

A long interval between events may reflect difficulty, interruption, background work, a meeting, or a tracking gap. A missing event may mean abandonment, but it may also mean the event was not instrumented correctly. Analytics tells you where to investigate; it does not automatically explain the human reason.

What session replay alone usually cannot show

A replay usually cannot reliably establish:

  • how representative one session is;
  • whether an issue affects many customers;
  • whether behavior changed over time;
  • whether the pattern is concentrated in a particular account segment;
  • whether the observed user ultimately received value through another workflow;
  • whether the user intended to churn, renew, upgrade, or contact support.

Even a visually striking session remains one case. Repeated clicks are observable; “rage” or frustration is an interpretation that requires context. A pause is observable; confusion is only one possible explanation. A user leaving a page is observable; intent to churn is not.

When the decision depends on motivation, supplement behavioral evidence with an interview, usability study, support conversation, survey, or another source that lets the user explain their experience.

Why B2B account context changes which sessions matter

In B2B SaaS, the customer is usually an account containing several users, roles, teams, and workflows. A replay from one user can be accurate for that person and still be misleading as evidence about the company.

Imagine an account with one experienced administrator who uses Reporting every day and twenty contributors who never complete an export. The administrator’s sessions may look efficient, and their volume may make Reporting appear healthy at the user or visit level. At the account level, adoption is concentrated around one person. That is a different product condition from broad adoption.

Session selection should therefore consider:

  • Affected company or workspace. Is the session from the account that contributed to the measured change?
  • User role. An administrator, champion, contributor, and viewer may see different controls or have different responsibilities.
  • Relevant product area. Did the session actually include the grouped page or workflow under investigation?
  • Account lifecycle. Is the company new, onboarding, established, reactivated, or losing momentum?
  • Adoption breadth and concentration. Is usage distributed across several people and workflows or dependent on one power user?
  • Current versus previous behavior. Is this normal for the account, or did its pattern change?
  • Plan or feature eligibility. Was the account and role expected to have access to the workflow being reviewed?

These dimensions prevent common category errors. A missing control in an ineligible account may be expected behavior. A slow first export by a new contributor should not be compared only with a daily workflow used by an experienced administrator. A replay from a champion should not stand in for the whole account.

For a fuller account-level measurement model, see How to measure product usage by company.

A signal-to-evidence workflow

A productive investigation connects a decision, a measurable pattern, selected session evidence, and validation. The following process works for product changes, onboarding problems, account reviews, and UX research.

1. Start with a product or customer decision

State the decision before opening analytics or replay. Examples include:

  • Should we change the Reporting export flow?
  • Which onboarding problem should the team investigate first?
  • Does a decline affect enough customer accounts to prioritize now?
  • Is a customer’s low adoption broad across the account or limited to one role?

A clear decision keeps the investigation from becoming an open-ended tour of dashboards and recordings.

2. Define a measurable signal

Choose the behavior, population, denominator, period, and comparison. “Exports fell” is incomplete. A stronger definition is: “The share of eligible active companies that completed at least one report export during the current 28-day period, compared with the preceding 28-day period.”

Document event definitions and eligibility rules before interpreting the result. Otherwise, a changed denominator or tracking release can look like a product change.

3. Identify the affected accounts

Move from the aggregate change to the companies that contribute to it. Check whether the result is broad or concentrated by plan, size, lifecycle, region, industry, onboarding stage, or another meaningful account attribute.

For B2B products, account segmentation often changes the question. A global decline may be entirely driven by newly onboarded accounts while established customers remain stable.

4. Inspect the users contributing to the signal

Within affected companies, identify the people who reached, completed, skipped, or stopped returning to the workflow. Compare roles and prior experience. Check whether activity is broad or concentrated in one champion.

This step turns “the account failed” into a more precise description of who encountered the measured condition.

5. Select relevant visits

Choose visits that contain the workflow, time period, release, user role, and outcome under investigation. Record the selection rule. Do not begin with whichever recordings happen to be newest or most dramatic.

6. Review a comparison group

A failed session is easier to interpret beside a comparable success. Useful comparisons include:

  • successful versus unsuccessful completion;
  • highly adopted accounts versus shallow adoption;
  • first-time versus experienced users;
  • visits before and after a product release;
  • users who returned versus users who did not.

The comparison group helps distinguish a shared interface pattern from normal variation.

7. Record observations without assigning intent

Describe what is visible: “The user returned to report setup three times,” not “The user was confused.” Note the page state, sequence, timing, controls, errors, and differences between comparison sessions. Separate observation from interpretation.

8. Form a specific hypothesis

Turn repeated observations into a testable explanation. For example: “After the release, first-time contributors on smaller viewports are less likely to see the primary export action before navigating back to setup.”

A hypothesis should be narrow enough to validate and falsify. “The export experience is bad” is not.

9. Validate across broader data

Return to structured events, account segments, users, time periods, and release versions. Check whether the hypothesized pattern appears at population scale. Where motivation matters, add direct research or support evidence.

Replay may generate the explanation to test; it does not establish prevalence by itself.

10. Change the product or process, then remeasure the original definition

Make the smallest justified change, then use the same population, denominator, event definitions, and comparison logic. If the measurement changes at the same time as the interface, you lose the baseline needed to judge the result.

A strong investigation therefore follows this path:

Product decision → Measurable signal → Affected account → Contributing user
→ Relevant visit → Comparison visit → Hypothesis → Broader validation
→ Change → Remeasurement
A product investigation moves from a measurable signal to an affected account, contributing user, relevant and comparison visits, a hypothesis, broader validation, and remeasurement.
A reliable investigation moves from signal to selected evidence, then back to broader validation.

Illustrative example: Reporting visits stay stable while company export completion falls

The following example is fictional. The names, numbers, events, segments, and product changes are illustrative and are not Hymetry customer data or a claim about customer results.

A B2B SaaS team compares two equal 28-day periods after releasing a redesigned Reporting export panel.

Illustrative example — not customer data

Reporting visits and account-level export completion across two illustrative 28-day periods.
MeasurePrevious 28 daysCurrent 28 daysWhat it suggests
Reporting visits1,2151,240Overall traffic is stable
Active companies reaching Reporting9698Account reach is stable
Companies completing at least one export7451Account-level completion fell
Completion among companies that reached Reporting77%52%A 25-percentage-point decline needs investigation

Looking only at visit volume would hide the problem. Reporting is still being opened. The meaningful signal is that fewer companies complete an export.

Illustrative Reporting investigation showing stable visits, fewer companies completing export, the affected account and role segment, selected successful and unsuccessful visits, a provisional hypothesis, and quantitative validation.
Stable traffic can hide an account-level completion decline; the signal determines which sessions are worth comparing.

Narrow the affected segment

The team breaks the result down by account lifecycle and user role. Completion remains stable for established accounts and experienced administrators. Most of the decline comes from accounts in onboarding and from contributors attempting their first export.

That finding changes session selection. The team does not need a random sample of all Reporting visits. It needs relevant visits from:

  • onboarding accounts and established accounts;
  • contributors and administrators;
  • successful and unsuccessful exports;
  • the period before and after the release.

The selection rule is documented so another reviewer can reproduce it.

Compare successful and unsuccessful visits

Several unsuccessful post-release visits from first-time contributors contain a similar visible sequence:

  1. The user opens Reporting and enters export settings.
  2. An advanced-options section is expanded in the reconstructed interface.
  3. The user scrolls through the panel and returns to report setup.
  4. The user re-enters export settings, changes one option, and returns to setup again.
  5. The visit ends without the instrumented export-submit event.

Comparable successful visits differ. Experienced administrators often use a saved configuration and reach the primary action quickly. Successful first-time contributors are more likely to encounter a viewport where the action remains visible while they review the required fields.

These observations do not prove that users were confused, that the advanced options caused the drop, or that every failed export followed this path. They support a narrower hypothesis: the redesigned default state and placement of the primary action may have made completion harder for first-time contributors, particularly in smaller viewports.

Validate the hypothesis with structured data

The team returns to the product analytics model and checks its instrumented steps and properties:

  • Entries into Reporting remain stable.
  • Export-start events remain stable.
  • Export-submit events decline after the release.
  • Transitions from export settings back to report setup increase.
  • The decline is concentrated among onboarding accounts, contributor roles, and the new layout version.
  • Established administrators and the previous layout remain closer to the earlier baseline.

This broader pattern is consistent with the replay-derived hypothesis. It still does not reveal each user’s motivation, so the team may add a short usability study or targeted customer conversation before making a large redesign.

Change and remeasure

The team makes a focused change: advanced options are collapsed by default, required settings receive a compact summary, and the primary export action remains visible while the panel is reviewed. It keeps the event definitions and account-level completion denominator unchanged.

After rollout, the team compares the next equal period using the same definition. It also reviews fresh successful and unsuccessful sessions from the affected segment to check whether the visible sequence changed. The decision is based on the account-level metric and comparison evidence, not on whether one replay looks smoother.

Why random recordings would have misled the team

The most recent recordings were dominated by experienced administrators from active accounts because those people generated the most visits. Randomly watching that list would have made the workflow appear healthy. Watching only one dramatic failure could have produced the opposite error: assuming every customer encountered the same problem.

The aggregate signal identified the affected population. Account and role context identified the people contributing to it. Replay generated a plausible interface-level hypothesis. Structured data tested whether that hypothesis matched the broader pattern. Each method did a different job.

Sampling and selection bias in replay review

Session recordings for product teams are not self-selecting evidence. The way sessions are chosen determines what the reviewer is likely to see.

Reviewing only failed or unusual sessions can exaggerate a problem because the sample excludes normal and successful behavior. Reviewing only successful sessions hides friction and workarounds. Reviewing only recent sessions may overrepresent a release, campaign, account, weekday, role, or customer that happened to be active. Reviewing only the longest sessions can exclude fast failures and efficient successes.

A handful of sessions can reveal a recurring pattern, but it cannot establish prevalence. Ten similar replays could come from one company, one user role, one browser, or one broken release. The denominator remains unknown until the observation is tested against structured data.

A practical answer to how to analyze session replays is to make the selection process explicit rather than relying on intuition. Use a lightweight sampling approach:

  1. Begin with the affected metric, period, and segment.
  2. Include both successful and unsuccessful outcomes.
  3. Include several companies and relevant roles rather than many sessions from one account.
  4. Add a meaningful comparison such as before versus after release or first-time versus experienced use.
  5. Document the filters, dates, outcomes, account criteria, and exclusions used to select the sample.
  6. Continue reviewing until additional sessions stop adding materially different patterns, but do not confuse that qualitative stability with measured prevalence.
  7. Treat every observed pattern as a hypothesis until broader analytics or direct research supports it.

There is no universal number of replays that makes a conclusion representative. The right sample depends on the decision, population, variation, capture quality, and cost of being wrong.

Privacy and security are part of the replay design

Session replay can expose much more context than an aggregate chart, including on-screen text, typed values, account names, internal records, and detailed employee or customer behavior. Event analytics can also contain sensitive identifiers and properties. Both systems require governance, but replay usually creates a larger capture surface.

A responsible implementation should include:

  • Data minimization. Define the investigation purpose and capture only the content and events needed for it.
  • Masking before storage. Mask sensitive text, inputs, and configured elements in the browser or otherwise before sensitive values are transmitted or stored whenever technically possible. Post-processing after collection leaves an avoidable exposure window.
  • Exclusions and blocking. Exclude sensitive routes, pages, fields, elements, embedded content, and workflows. Disable recording entirely where the risk or legal requirements outweigh the analytical value.
  • Production verification. Test masking and blocked-page rules with production-like content before rollout, then retest after major interface changes. A CSS or component change can invalidate a selector-based rule.
  • Access controls. Restrict replay access to people with a documented need. Use least privilege rather than giving every employee broad access to recordings.
  • Access auditing. Record and review employee access to replay data, especially for sensitive accounts or environments.
  • Retention and deletion. Set a purpose-based retention period, delete recordings that are no longer needed, and ensure deletion rules apply to derived or exported copies where appropriate.
  • Legal and consent review. Notice, consent, lawful-basis, employee-monitoring, and contractual requirements vary by jurisdiction and context. Obtain qualified legal advice for the actual implementation rather than assuming a generic configuration is compliant.

Masking is not a guarantee, and self-hosting does not remove privacy or security responsibilities. The team still controls what is captured, who can see it, how long it remains, and how the rules are verified.

Hymetry’s Privacy Controls describe the product’s configurable approach to filtering fields and excluding pages or elements. This article is not a full session-replay privacy guide; treat privacy architecture as a separate implementation workstream before relying on replay in production.

Common mistakes when combining analytics and replay

Browsing random sessions without a question

A replay library encourages exploration, but unstructured viewing produces whatever anecdotes the list happens to surface. Begin with a product or customer decision and a selection rule.

Treating one dramatic replay as representative

A severe-looking failure may matter, especially for security, accessibility, or data loss, but it does not reveal prevalence. Separate severity from frequency and measure both.

Using replay instead of measuring frequency

Watching several similar sessions does not tell you how many users or companies are affected. Use product analytics to define the denominator and compare segments.

Using analytics without inspecting evidence

A clean funnel can hide rendering problems, unexpected states, missing controls, or uninstrumented behavior. When a meaningful signal needs an interface-level explanation, inspect relevant sessions.

Reviewing only failed sessions

Without successful comparisons, normal behavior can look anomalous and common friction can be mistaken for a unique failure. Review both outcomes.

Interpreting pauses as confusion

A pause can reflect reading, interruption, background work, a slow system, or a tracking gap. Describe the duration and visible state; do not assign a mental state without additional evidence.

Interpreting repeated clicks as frustration without context

Repeated clicks may indicate a non-responsive control, impatience, an intentional repeated action, accessibility behavior, or event duplication. Inspect the surrounding state and validate the pattern.

Assuming replay reveals intent

Replay shows captured behavior, not motivation. It cannot prove that a person intended to churn, wanted a feature, understood the copy, or considered the workflow valuable.

Recording sensitive information unnecessarily

Do not collect text, inputs, pages, or event properties merely because the recorder can. Minimize and block by default according to the defined purpose.

Giving broad internal access to recordings

Detailed session evidence should not become casual company-wide browsing. Use role-based access, purpose-limited workflows, retention, and access audits.

Ignoring account and user context

A power user, an onboarding contributor, and an ineligible viewer are not interchangeable. Compare company, role, lifecycle, prior behavior, and feature access before generalizing.

Changing the product after one anecdotal session

Use replay to form or refine a hypothesis. Validate it against broader data and, when needed, direct research before making a consequential change.

When to use session replay, product analytics, or both

Start of the questionBest starting methodReason
How many, how often, which segment, which accounts, what changed, where in the workflow, or compared with what?Product analyticsThe question requires a defined population, denominator, distribution, time period, or comparison.
What appeared on screen, what sequence occurred, what interface state preceded the problem, or how did selected users navigate?Session replayThe question requires close inspection of a specific visit or deliberately selected group of visits.
What evidence could help explain this measured pattern, and is the problem important enough to prioritize?BothAnalytics locates and sizes the signal; replay helps inspect possible mechanisms; analytics and research validate the hypothesis.
What did the user think, why did they choose this action, or do they intend to churn?Neither aloneAdd interviews, usability research, support context, surveys, or other direct evidence of meaning and intent.

Use product analytics first when the main uncertainty is frequency, distribution, change, adoption, segmentation, or comparison. Use replay first when a known support case, bug report, or identified visit requires reconstruction. Use both when the team must understand and prioritize a product problem.

How Hymetry combines product signals and session evidence

Hymetry is account-centric product intelligence for B2B SaaS. It connects four analytical layers so a team can move from a broad signal to session-level evidence without treating those layers as interchangeable:

  • Pages provides product-area and grouped-page signals such as account adoption, users, visits, engaged time, interaction, flows, and trends.
  • Companies adds account-level context such as adoption breadth, user concentration, lifecycle, segment, and changes in behavior.
  • Users identifies the people contributing to the signal and keeps their activity inside company context.
  • Visits provides the session-level path, timing, events, replay, and source context for visits worth inspecting.

A practical investigation can follow this path:

Product signal → Affected company → Contributing user → Relevant visit

For example, a decline on a grouped Reporting page can lead to the companies responsible for the change, then to the users who stopped completing the workflow, then to selected Visits that contain the relevant sequence. The replay can help the team form a hypothesis, but it does not prove why the metric changed. The team should still compare sessions and validate the pattern across broader data.

This connected model is useful for product teams deciding what deserves roadmap attention and for UX researchers choosing sessions that match a research question. The value is not more recordings. It is a shorter, reviewable path from a measurable account or product signal to the evidence behind it.

Frequently asked questions

Is session replay qualitative or quantitative?

Reviewing individual session replays is usually qualitative, observational analysis: a researcher inspects a selected sequence and records patterns. Replay metadata or derived events can be aggregated quantitatively, but a few watched sessions do not establish prevalence. Product analytics is still needed to measure how common the behavior is across the relevant users, accounts, and time period.

Is session replay the same as a screen recording?

Not necessarily. Browser session replay is commonly reconstructed from a serialized DOM snapshot, later DOM mutations, interactions, and timing data rather than stored as a continuous video of the user’s screen. Implementations differ, and native mobile replay can use other capture methods. Review the documentation and privacy model of the actual tool being deployed.

When should a product team use session replay?

Use session replay when a known support case or measurable product signal identifies a relevant session or segment and the team needs to inspect sequence, visible interface state, navigation, or context. Avoid starting with an undifferentiated list of recent recordings.

Can session replay explain why a user abandoned a workflow?

It can show what the capture system reconstructed before abandonment and can support a hypothesis about possible friction. It cannot reveal the user’s thoughts or prove motivation. Direct research may be needed to understand why the user acted that way.

How many session replays should a team review?

There is no universal sample size. Select successful and unsuccessful sessions from the affected segment, include several accounts and relevant roles, document the rule, and continue until additional sessions stop adding materially different patterns. Then validate prevalence with structured analytics rather than treating the sample as representative by itself.

Should a team watch every recording?

No. Watching every replay is rarely a sensible operating model. Use product analytics, account context, support information, or a research question to prioritize the visits worth reviewing.

How should product analytics and session replay work together?

Start with a decision and measurable signal. Identify the affected accounts and contributing users. Select relevant visits and a comparison group. Record observations, form a testable hypothesis, validate it across broader data or direct research, make a focused change, and remeasure using the original definition.

Sources

Browser session replay and web standards

Product analytics and account data

Privacy and security

Hymetry product references

About Hymetry

Hymetry is account-centric product intelligence for B2B SaaS. It helps teams understand how customer companies and the users inside them adopt and use their product.