Quick comparison
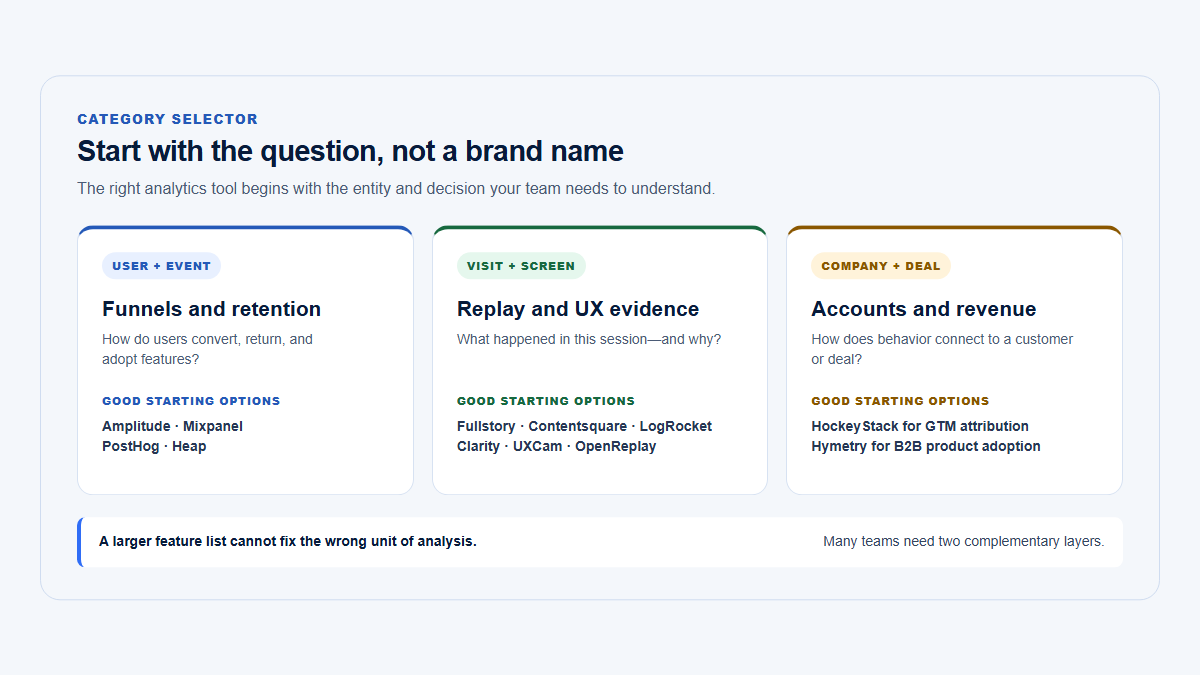
The fastest way to decide between HockeyStack and Mixpanel is to write down the business question before looking at a feature grid.
A question such as “Which campaign and sales touches preceded this opportunity?” starts with commercial identities, CRM stages, and revenue. HockeyStack is designed around that model.
Questions each platform answers
| Business question | HockeyStack | Mixpanel | What it means |
|---|---|---|---|
| Which campaigns created pipeline? | Strong, direct | Possible, but not CRM-native | HockeyStack is designed to allocate commercial outcomes across campaign and buyer touchpoints. Mixpanel needs pipeline data to be supplied and modeled. |
| Which accounts reached an opportunity? | Strong, direct | Custom import or event model | Opportunity and funnel-stage objects are natural parts of HockeyStack’s commercial model. |
| Which product features do users adopt? | Limited or imported signal | Strong, direct | Mixpanel’s event reports, funnels, cohorts, and retention are built for this analysis. |
| Which companies complete onboarding? | Possible when supplied as an account signal | Strong with Group Analytics | Mixpanel can evaluate a funnel by company ID rather than only by user ID. |
| Which users return? | Secondary use case | Strong, direct | Retention analysis is a central Mixpanel workflow. |
| Which sessions show friction? | Not native in reviewed sources | Strong, direct | Mixpanel connects reports and cohorts to replay, heatmaps, dead clicks, and rage clicks. |
| Which experiment improves activation? | Not native in reviewed sources | Strong, direct | Mixpanel can manage flags, exposure, and experiment results around product metrics. |
| Which product usage precedes expansion? | Strong commercial context when usage is imported | Strong behavioral evidence when revenue data is joined | The most complete answer usually combines product evidence with CRM, billing, and warehouse data. |
| Can the platform establish causality? | Not through attribution alone | Not through observational reports alone | Randomized experiments, credible holdouts, or lift designs are needed for stronger causal claims. |
Can one replace the other?
| Question | Short answer | Main compromise |
|---|---|---|
| Can HockeyStack replace Mixpanel? | Usually not when product analytics is a major job. | You give up the depth of native funnels, retention, cohorts, replay, experiments, flags, and mobile product analysis. It may be enough when “product usage” means only a few summarized GTM signals. |
| Can Mixpanel replace HockeyStack? | Usually not when B2B attribution and CRM opportunity journeys are major jobs. | You must construct buyer, campaign, sales-touch, account, opportunity, pipeline, and revenue relationships through integrations, the warehouse, and custom models. |
| Should a PLG company use both? | Often, especially with sales assistance. | Shared IDs, governed definitions, and explicit metric ownership are required to prevent contradictory dashboards. |
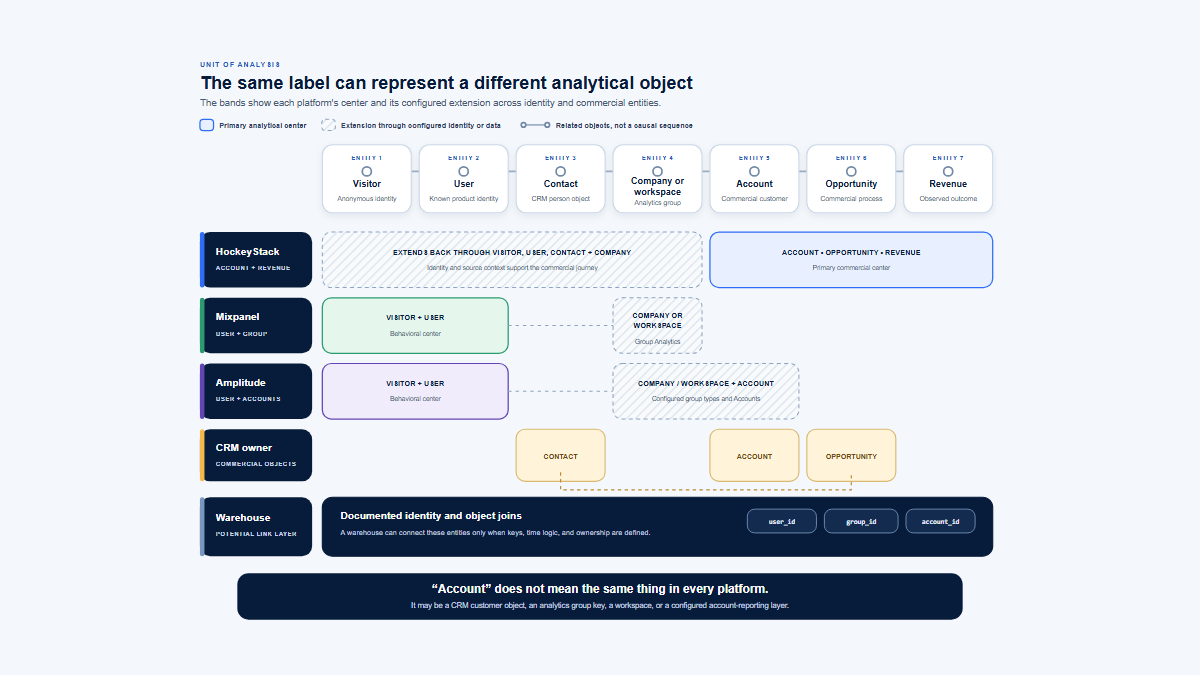
HockeyStack’s documentation models sales and marketing touchpoints from systems such as the CRM and connects them to companies and commercial outcomes. Mixpanel models behavioral events around a distinct_id, with Group Analytics adding alternative identifiers such as company, account, project, or billing ID. These are complementary models, not interchangeable labels.
Revenue intelligence, or product behaviour
HockeyStack
Revenue and go-to-market intelligence
Shared ground
Mixpanel
Product behaviour analytics
Which motion produced revenue What people do inside the product
Most teams that consider both end up needing both. The overlap is where metric ownership gets contested, so decide there first.
Accounts, users, CRM, and identity
HockeyStack begins closer to the B2B commercial account. Mixpanel begins closer to the behavioral event and user, then adds company-level analysis through Group Analytics.
That does not make Mixpanel user-only. Its paid Group Analytics package can use an event property such as company_id, account_id, project_id, or billing_id as an alternative unit of analysis. It supports group funnels, group profiles, B2B Company Analytics, company-health views, and activation questions such as how many trial companies contain more than a specified number of active users.
Identity and account model
| Entity or signal | HockeyStack | Mixpanel |
|---|---|---|
| Anonymous visitor | Captures web and marketing touchpoints, then uses identity resolution to connect later-known activity | Uses an anonymous distinct ID that can later be connected to an identified user |
| Lead or contact | Natural CRM and buyer-journey entity | Usually represented as a user profile or imported business record |
| Product user | Can be ingested or connected as a GTM/account signal | Primary behavioral identity |
| Company or account | Primary commercial entity | Group/company key when Group Analytics is configured |
| Workspace or group | Usually represented through account and connected business-system data | Arbitrary group keys can represent company, workspace, project, device, subscription, or another shared entity |
| Opportunity | Natural CRM-synced commercial object | Imported event, property, lookup, profile, or warehouse record |
| Campaign | Core attribution and spend context | Campaign and attribution properties can be analyzed against behavioral events |
| Sales touchpoint | Core journey input | Must be imported or emitted as a custom event |
| Product event | Connected action or imported product signal | Core analytical object |
| Visit or session | Web visit and commercial-journey touchpoint | Session object with native replay and behavioral event context |
| Subscription and revenue | CRM, billing, opportunity, and revenue-reporting context | Supplied as event, profile, lookup, or warehouse data |
| Multi-account users | Resolved through explicit CRM, domain, person, company, and opportunity relationships | Must pass the correct group identifiers and define how events relate to one or more groups |
| Account matching | HockeyStack identity resolution is intended to connect anonymous, person, business, and opportunity identities | The implementation owns ID merge, group-key assignment, aliases, and account mapping |
| Warehouse attributes | Imported and exported through Data Syncs or assisted connections | Ingested through Warehouse Connectors and lookups; exported through APIs or Data Pipelines |
HockeyStack’s identity resolution is valuable when several people from the same company interact across ads, content, forms, email, meetings, and sales activity before an opportunity exists. Mixpanel’s identity system is valuable when anonymous activity must be joined to an authenticated user and then analyzed at both user and company level.
HockeyStack documents a unified action and touchpoint foundation that connects CRM, marketing, and sales activity. Mixpanel documents event, user, and group identities with implementation-controlled group keys.
Product behavior, funnels, and retention
Mixpanel is the clearer choice when the daily work starts with product behavior.
Its standard analysis model includes Insights, Funnels, Flows, and Retention. Teams can segment events and users, save behavioral cohorts, analyze conversion paths, measure return behavior, and move from an aggregate report into the users or sessions behind it.
HockeyStack can incorporate product activity into an account and revenue story. Official documentation also describes importing trial or product-analytics data when a direct integration is not available. That is useful for questions such as whether an activated account progressed to opportunity or whether a usage signal appeared before expansion. It should not be presented as equivalent to Mixpanel’s complete product-analysis workflow.
Analytics and action
| Capability | HockeyStack | Mixpanel |
|---|---|---|
| Account journey | Core commercial-account timeline | Behavioral group journey when group keys and events are implemented |
| Attribution | Core B2B campaign, touchpoint, pipeline, and revenue use case | Campaign reporting and multi-touch attribution inside the event model |
| Pipeline | Core CRM and opportunity use case | Requires imported pipeline data |
| Revenue | Core reporting outcome | Analyzable when revenue data is supplied |
| Product funnel | Possible for selected connected actions | Core report |
| Retention | Not a primary native product workflow | Core report |
| Cohorts | Segmentation for accounts and commercial activity | Core behavioral capability |
| Account or Group Analytics | Account intelligence tied to commercial identities | Paid Group Analytics and B2B Company Analytics |
| Replay | No native capability documented in the reviewed official sources | Native web and mobile replay |
| Experiments | No native product experimentation documented | Native experiment analysis and management; Enterprise add-on |
| Feature flags | No native product flag system documented | Native flags with automatic exposure tracking; Enterprise add-on |
| Product alerts | Account, scoring, GTM signal, and workflow context | Behavioral monitoring, alerts, anomalies, and cohort-based actions by plan |
| Exports and integrations | GTM integrations, Data Syncs, and assisted data connections | SDKs, integrations, Warehouse Connectors, raw export, cohort sync, and Data Pipelines |
A fictional B2B SaaS example
Northwind Metrics is a fictional B2B reporting product. It runs paid campaigns and educational content, attracts several buyer contacts from each company, offers a free trial, and has multiple product users per customer. Trial users complete onboarding and begin using the Reporting area. Sales creates an opportunity in the CRM, the account subscribes, and the company later approaches renewal or expansion.
| Business question | HockeyStack | Mixpanel | Metric owner |
|---|---|---|---|
| Campaign source | Connect campaign and touchpoint history to the company and opportunity | Preserve source properties on anonymous and identified users | Marketing operations |
| Buyer journey | Reconstruct marketing and sales activity across contacts and the account | Show the acquisition-to-product sequence for instrumented users | RevOps |
| Pipeline | Report opportunity stage and attributed pipeline | Analyze only after pipeline data is imported | RevOps |
| Trial activation | Consume a summarized activation signal if supplied | Build the activation funnel from product events | Product growth |
| Product funnel | Use selected product actions as journey signals | Analyze each onboarding and Reporting step | Product |
| Account adoption | Use a governed adoption summary as account context | Analyze Reporting adoption by company through Group Analytics | Product analytics or customer success |
| User penetration | Consume a summarized account signal | Calculate from users and company IDs when the model is implemented explicitly | Product analytics |
| Replay | No native replay workflow documented | Inspect sessions behind funnel drop-offs or friction cohorts | UX or product |
| Experiment | Consume the resulting activation signal | Assign variants, track exposure, and evaluate product metrics | Product growth |
| Expansion evidence | Join usage signals to opportunity and revenue context | Show product behavior that preceded the commercial change | Customer success and RevOps |
| Revenue reporting | Own CRM-connected pipeline and revenue views | Supply behavioral evidence, not the authoritative booked-revenue number | RevOps and finance |
The two platforms become most useful together when Mixpanel owns the detailed behavioral evidence and HockeyStack consumes governed commercial or product summaries. Do not let both systems independently redefine activation, adoption, pipeline, or expansion.
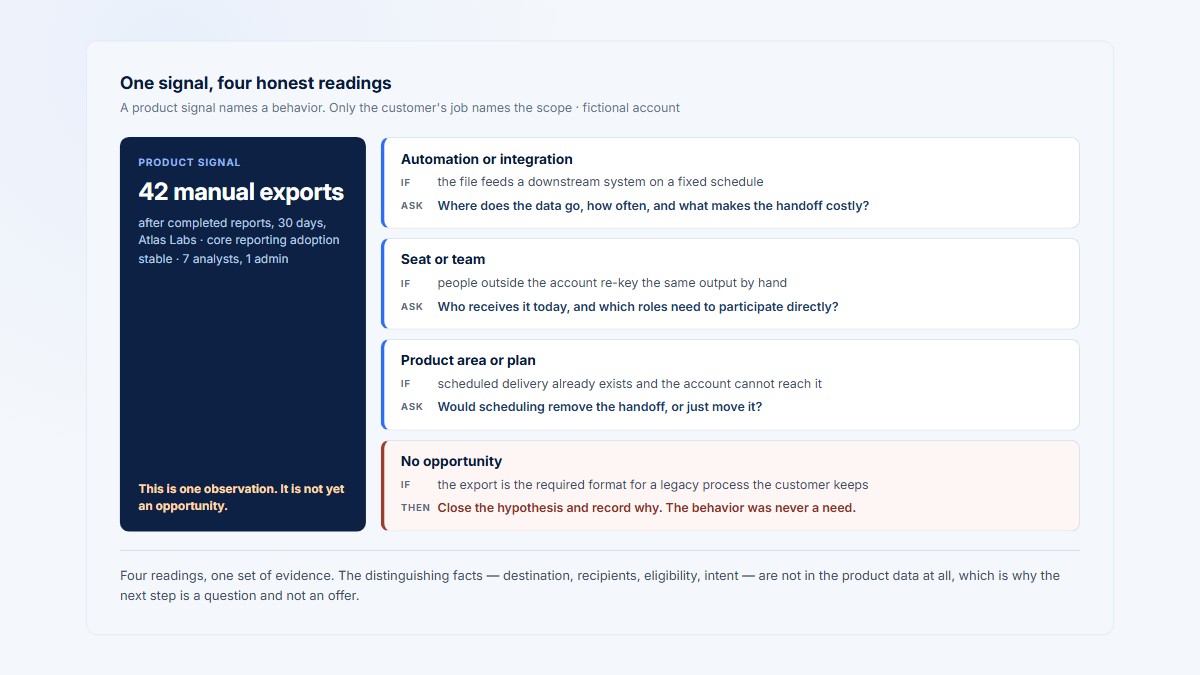
Product usage can support an expansion hypothesis, but it does not prove that usage caused expansion or that the account intends to buy. Keep the CRM, customer conversation, contract, billing state, and product evidence separate until a person evaluates them together.
Illustrative: one Northwind Metrics account, end to end
1
Campaign and company visits
2
Buyer contacts
3
Trial company
4
Onboarding, several users
5
Reporting adoption
6
Opportunity and subscription
7
Renewal or expansion
HockeyStack owns this evidence
Mixpanel owns this evidence
Joined by governed identity
CRM and billing stay authoritative
A fictional account for illustration. The two products own different evidence along the same journey; neither reconstructs the other's half, and commercial records remain the source of truth for revenue.
Attribution, pipeline, and revenue
HockeyStack is the stronger fit when the outcome lives in the CRM rather than only inside the product.
Its data model is designed around touchpoints from marketing, sales, and connected systems. Funnel stages can be tied to CRM opportunity or deal stages, while attribution reports allocate pipeline or revenue credit across selected touchpoints and models. HockeyStack also documents lookback controls, custom attribution configuration, and lift analysis.
Mixpanel now includes campaign reporting and multi-touch attribution in its paid product packaging. That can connect acquisition properties and pre-login activity to later product behavior, especially when anonymous and identified IDs are merged correctly.
The distinction is that Mixpanel’s natural outcome is still an event or metric in the behavioral model. It does not automatically provide the complete B2B account, buyer-contact, sales-activity, CRM-opportunity, pipeline, and booked-revenue context that HockeyStack is designed to assemble.
HockeyStack itself distinguishes lift analysis from multi-touch attribution. Mixpanel’s randomized experiments can support causal inference when assignment, exposure, metrics, sample size, and experiment health are valid. Ordinary funnel, cohort, attribution, or correlation reports remain observational.
Replay, experiments, integrations, and implementation
Mixpanel has the broader native toolkit for investigating and changing product behavior. HockeyStack has the more specialized integration and implementation model for connecting a B2B revenue stack.
Replay and autocapture
Mixpanel Session Replay connects aggregate reports to individual sessions. Teams can filter replays using events, properties, or cohorts, move from funnel drop-offs into relevant recordings, and use web heatmaps and frustration signals as supporting evidence. The current product supports web and mobile replay, with customizable retention from seven days to one year depending on packaging.
Mixpanel’s web Autocapture can collect page views, scrolling, form interactions, element clicks and changes, attribution properties, dead clicks, and rage clicks. It is available on all plans but must be enabled and privacy-tested. Android and Swift SDKs provide lower-instrumentation screen-view and screen-leave helpers, but these do not match the full web event set and generally require navigation integration.
Experiments and feature flags
Mixpanel can target feature flags using behavioral cohorts, track exposure automatically, and evaluate primary, secondary, and guardrail metrics. Experiment results can be investigated alongside the same behavioral reports and replays used by the product team. The current pricing documentation lists Experiment Report and Feature Flags as separately priced Enterprise add-ons.
No equivalent native HockeyStack product-experiment or feature-flag system was documented in the official sources reviewed. HockeyStack can still receive the experiment result, account segment, activation state, or product signal as part of the commercial journey.
Integrations and warehouse movement
HockeyStack’s implementation documentation emphasizes getting connected GTM data into the platform accurately, establishing starter reporting, and supporting complex data environments. Data Syncs can import or export custom data, while warehouse connections and raw-action exports depend on the configured scope.
Mixpanel provides several separate data paths:
- SDKs, APIs, and autocapture for behavioral events;
- Warehouse Connectors for Snowflake, BigQuery, Databricks, Redshift, and Postgres;
- raw event, user-profile, and group-profile exports;
- CSV and report exports;
- Cohort Syncs for external destinations;
- Data Pipelines for continuous export to cloud storage or warehouses.
Warehouse Connectors are available as a free add-on when an organization on a paid event-based plan updates or renews. Data Pipelines are separately packaged for Growth and Enterprise, so reverify the current plan details before purchase.
A shared architecture for a sales-assisted PLG company
HockeyStack
- marketing and sales touchpoints
- account journey
- pipeline and revenue
- attribution

Mixpanel
- authenticated product behavior
- funnels and retention
- Group Analytics
- replay and experiments
A practical shared architecture uses:
- the same durable product-user ID across authenticated product events;
- the same company or workspace ID on every relevant product event;
- an explicit mapping between product company ID and CRM account ID;
- CRM contact and opportunity IDs in the warehouse;
- preserved campaign, source, and landing-context properties;
- billing or subscription IDs for recognized revenue;
- governed summary signals sent between systems instead of duplicated calculations.
For example, Mixpanel may own the definition of Trial activated, Reporting adopted, or Three active users in the last 14 days. A warehouse model can attach those signals to the authoritative company and CRM account. HockeyStack can then use the governed signal alongside campaign, sales, opportunity, and revenue data.
Two lanes, one identity contract, no duplicate owners
Inputs
Shared contract
Lanes
The architecture is something you govern rather than buy. Assigning one owner per metric prevents the most common failure: two correct numbers that contradict each other.
Videos
HockeyStack account journeys and attribution
The supplied official HockeyStack Demo remains public, but it was published on October 10, 2022, before the current platform positioning. It is listed in Sources rather than embedded as a current-interface walkthrough. Use the current official Marketing Intelligence documentation for capability verification.
Mixpanel self-serve product analysis
Pricing and customer feedback
Mixpanel has the more transparent self-serve entry point. HockeyStack publishes no list price and routes buyers through sales.
HockeyStack’s official pricing page publishes no list price and routes buyers through a sales form. It says every plan includes GTM and CRM integrations, hands-on support, custom setups for complex data environments, and ROI reporting. Confirm contract scope, implementation, and terms directly with sales.
Sales-led pricing
HockeyStack
No public list price
Sales-led evaluation; confirm contract scope, data environment, implementation, and total cost directly.
Event-based
Mixpanel
1M events
Free and Growth start at $0 for the first one million monthly events; Enterprise and advanced add-ons use custom terms.
Pricing and ratings
| Pricing or review point | HockeyStack | Mixpanel |
|---|---|---|
| Free plan or trial | No public self-serve free plan was shown. Confirm any pilot or evaluation terms with sales. | Free forever; no credit card required |
| Public or sales-led starting model | The current pricing page publishes no list price and directs buyers to sales. | Free plan; Growth starts at $0 for the first 1M monthly events, then usage-based; Enterprise is custom |
| Primary billing unit | Not publicly standardized; contract and scope dependent | Monthly event volume, with unlimited seats |
| Integration or report limits | Contract-specific; the current pricing page describes broad integrations, reporting, support, and setup | Free includes five saved reports per seat; paid tiers list unlimited saved reports |
| Event and replay allowances | Contract-specific; no native replay allowance documented | Free: 1M events and 10K replays/month. Growth: first 1M events free, up to 20M events, 20K replays included and configurable up to 500K/month. Enterprise: custom, up to 1T events. |
| Group Analytics packaging | Account intelligence is part of the commercial platform, but the current pricing page does not itemize its limits; confirm with sales | Group Analytics and account-level behavioral analytics are paid add-ons on Growth or Enterprise |
| Experiments and feature flags | No native product experiment or flag packaging documented | Experiment Report and Feature Flags are separately priced add-ons offered on Enterprise |
| Implementation services | Assisted implementation and custom setup for complex data environments | Self-serve implementation is possible; Enterprise professional services and custom terms are available |
| G2 rating and count | 4.5/5 from 82 reviews | 4.5/5 from 1,371 reviews |
| Verification date | August 13, 2026 | August 13, 2026 |
| Official links | HockeyStack pricing | Mixpanel pricing |
The defensible conclusion from the official pages is that HockeyStack does not publish a list price, while Mixpanel offers a public free and usage-based path. G2 was used for ratings, review counts, and directional review themes—not pricing.
Customer rating
HockeyStack
Customer rating
Mixpanel
What customers repeatedly mention
Review themes below are directional summaries of recent and aggregate G2 excerpts, not a formal coded sentiment study. Do not convert them into percentages or claims such as “most users.”
| Product | G2 rating | Recurring positive themes | Recurring cautions | Editorial interpretation |
|---|---|---|---|---|
| HockeyStack | 4.5/5, 82 reviews | Attribution and account-journey visibility; customizable reporting; useful insights; integrations and supportive team interactions | Some recent reviewers describe implementation difficulty, data-connectivity or data-trust problems, support responsiveness, and reporting or visualization limitations | Strong reported value when the data foundation and implementation work well, but buyers should test identity, connectivity, ownership, and validation before committing |
| Mixpanel | 4.5/5, 1,371 reviews | Intuitive and flexible analysis; fast event reporting; useful funnels, dashboards, and self-serve exploration | Event-taxonomy setup, data governance, custom-report learning curve, and costs as event volume scales | Mature product-analysis depth, with implementation quality and event discipline still determining whether teams trust the result |
HockeyStack’s lower review volume makes individual recent reviews more visible in the overall impression. Mixpanel has a much larger review corpus, but review volume does not tell a buyer whether its event model will be implemented correctly. In both cases, evaluate the data contract rather than treating the average star rating as proof of fit.
Which one fits your scenario?
Choose by the workflow your team needs to own. Use both only when the company is prepared to govern the overlap.
| Scenario | Recommended setup | Why | Main watch-out |
|---|---|---|---|
| Demand-generation team | HockeyStack | Campaign, content, account, opportunity, pipeline, and revenue questions are the center of the work | Attribution model choice does not prove incremental impact |
| Product-growth team | Mixpanel | Funnels, cohorts, retention, behavioral segmentation, replay, and experiments are primary | Define events and identities before building dashboards |
| RevOps team | HockeyStack, usually backed by CRM and warehouse governance | Commercial identities, funnel stages, sales touches, and revenue reporting are the main concern | Validate source-system hygiene and opportunity logic |
| Product manager | Mixpanel | Faster access to feature adoption, conversion, return behavior, segments, and sessions | Company-level B2B questions may require the Group Analytics add-on |
| PLG SaaS with sales assistance | Both | Product behavior and the commercial buyer journey answer different questions | Assign one owner to every KPI and map product company IDs to CRM accounts |
| Customer-success team | Mixpanel or Hymetry for product evidence; HockeyStack for commercial context | Success teams may need both account adoption and pipeline or renewal context | Product usage is evidence, not a churn or expansion verdict |
| Company with a warehouse | Both can work well | The warehouse can govern identity, account facts, billing, and cross-system summaries | Do not create several competing transformation layers |
| Organization needing both pre-sale and in-product analysis | Both | HockeyStack covers the commercial journey; Mixpanel covers the behavioral journey | Budget for integration, data governance, validation, and ongoing ownership |
Practical recommendations
A demand-generation or RevOps team should start with HockeyStack when the main deliverable is an account, opportunity, pipeline, or revenue report. Adding Mixpanel first will not remove the need to model the CRM and buyer journey.
A product or growth team should start with Mixpanel when the main deliverable is an activation funnel, retention analysis, company-level onboarding view, replay investigation, or product experiment. Adding HockeyStack first will not create the same depth of behavioral analysis.
Continue with the broader product analytics tools comparison, the direct Mixpanel vs PostHog comparison, or the guides to B2B product analytics, measuring product usage by company, product usage and expansion opportunities, and product usage before a renewal meeting.
Where Hymetry fits
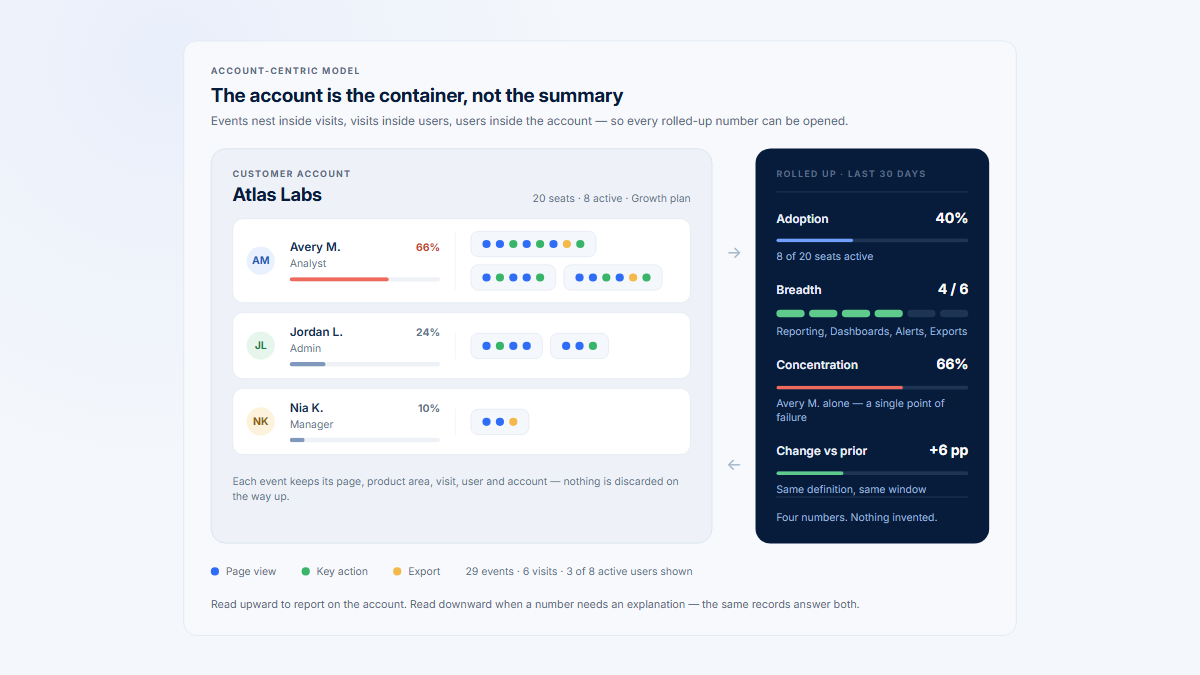
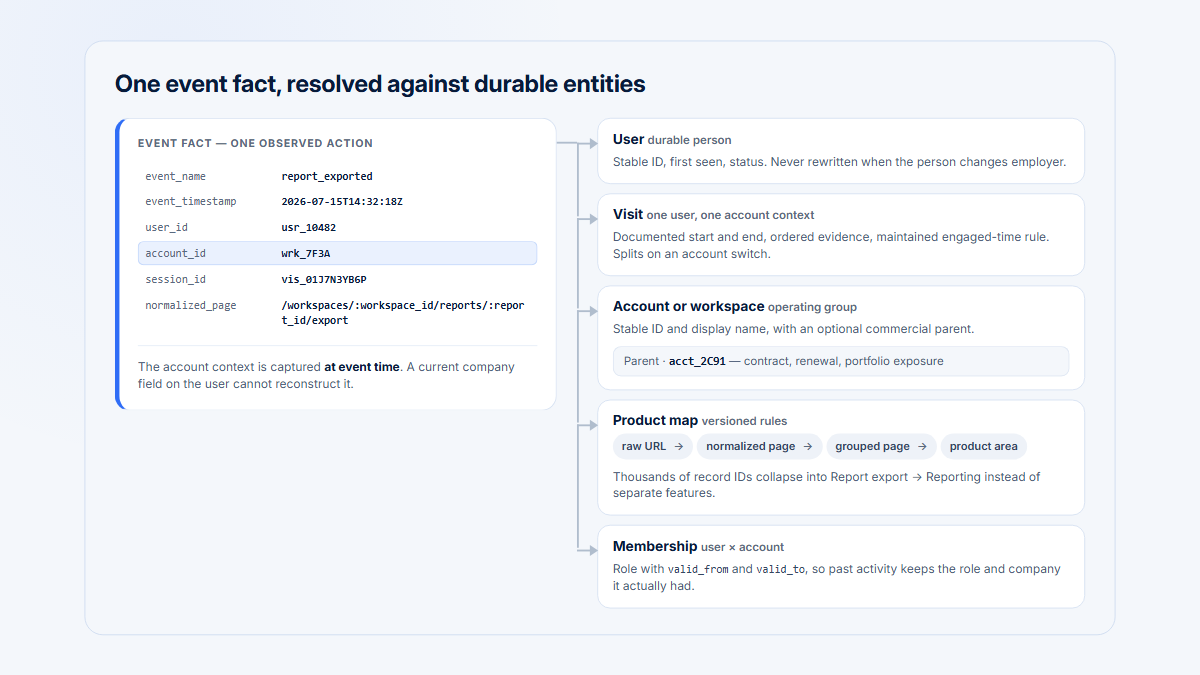
Hymetry is account-centric product intelligence for B2B SaaS. It connects product usage across Pages, Companies, Users, and Visits so teams can understand what an account adopts, how broadly usage spreads across its users, where workflows lose momentum, and which sessions provide evidence for a signal.
That puts Hymetry in a narrower position than either platform in this comparison.
Hymetry may also be considered instead of Mixpanel when company-level product usage is the central need and the team does not require Mixpanel’s broader event analytics, flexible funnels, retention analysis, Group Analytics configuration, mobile analytics, experiment platform, or feature flags.
Hymetry does not replace:
- HockeyStack attribution;
- CRM account and opportunity management;
- sales-activity tracking;
- pipeline or revenue reporting;
- Mixpanel’s broad product-event analysis;
- Mixpanel experiments or feature flags.
The distinction is useful for B2B SaaS teams that do not merely want to know that a company was active. They want to know which product areas it adopted, how many users participated, whether activity is concentrated in one champion, and which Visits support the conclusion.
Explore Hymetry’s Companies, Users, Pages, and Visits.
FAQ, methodology, and sources
Is HockeyStack a Mixpanel alternative?
Only for a limited subset of needs. HockeyStack can replace Mixpanel when the organization needs a few product-usage signals inside a B2B account, attribution, and revenue workflow rather than deep behavioral product analytics. It is not a complete replacement for Mixpanel funnels, retention, cohorts, replay, experiments, flags, or mobile analytics.
Can Mixpanel replace HockeyStack?
Not as a turnkey B2B attribution and revenue-intelligence system. Mixpanel can ingest campaign, CRM, account, opportunity, and revenue data, but the organization must model those relationships and build the reporting logic. HockeyStack is designed around that commercial journey.
Which is better for product analytics?
Mixpanel. Its event model, funnels, retention, cohorts, Group Analytics, replay, mobile support, experiments, and flags are designed for product and growth decisions. HockeyStack is better when product usage is one input to a broader commercial-account and revenue analysis.
Which is better for B2B attribution?
HockeyStack. Its account, buyer-touchpoint, CRM-opportunity, pipeline, and revenue model is the more direct fit for B2B marketing attribution. Mixpanel’s campaign reporting and multi-touch attribution are useful for acquisition-to-product analysis but should not be mistaken for a complete B2B revenue-attribution stack.
Which supports account-level analysis?
Both, but they mean different things by account analysis. HockeyStack focuses on commercial accounts, buyer contacts, opportunities, sales and marketing touches, pipeline, and revenue. Mixpanel Group Analytics focuses on product behavior aggregated by a company, workspace, project, billing ID, or another group key.
Should a PLG company use both?
A sales-assisted PLG company often benefits from both. Mixpanel can own product activation, adoption, retention, replay, and experiments. HockeyStack can own marketing and sales journeys, attribution, opportunities, pipeline, and revenue. Shared company IDs and explicit metric ownership are essential.
Where does Hymetry fit?
Hymetry focuses on account-centric product evidence for B2B SaaS: Pages, Companies, Users, Visits, account adoption, adoption breadth, user penetration, usage concentration, and session evidence. It may complement HockeyStack or serve as a narrower alternative to broad product analytics when company-level product usage is the primary need. It does not replace attribution, CRM, pipeline, revenue reporting, or Mixpanel’s complete behavioral toolkit.
Methodology and evidence limits
Methodology
This comparison used a category-first method rather than a feature-count score.
The evaluation considered:
- the primary entity each platform models;
- the questions its standard workflows answer;
- identity and account structure;
- product analytics depth;
- marketing, CRM, pipeline, and revenue depth;
- replay, experimentation, integration, and warehouse paths;
- official pricing and packaging;
- comparable G2 ratings and directional review themes;
- the compromises involved in replacing one product with the other.
Official vendor documentation was prioritized for capabilities and packaging. G2 was used for comparable customer ratings, review counts, and review themes. Independent causal-inference sources were used for the attribution limitation.
No hands-on product benchmark was performed. Absence statements mean that the capability was not documented as a current native core capability in the official sources reviewed; they do not prove that no custom workflow, integration, beta, or contractual feature exists.
Publisher disclosure
Disclosure
Hymetry publishes this article and may be considered alongside HockeyStack or Mixpanel for account-level B2B product intelligence. No vendor paid for inclusion or placement. The article does not use affiliate links. Product capabilities, integrations, pricing, packaging, review counts, and videos can change after the verification date.
Sources
Capabilities and packaging were reverified against official sources on . G2 supplied comparable ratings, counts, and directional review themes. Video availability, titles, channels, dates, and durations were checked separately.
Official HockeyStack product and documentation sources
- HockeyStack Platform Overview — HockeyStack, verified August 13, 2026
- HockeyStack Marketing Intelligence — HockeyStack, verified August 13, 2026
- HockeyStack GTM Intelligence — HockeyStack, verified August 13, 2026
- HockeyStack data model — HockeyStack Docs, verified August 13, 2026
- HockeyStack Data Foundation — Atlas — HockeyStack Docs, verified August 13, 2026
- HockeyStack identity resolution — HockeyStack Docs, verified August 13, 2026
- HockeyStack funnel stages — HockeyStack Docs, verified August 13, 2026
- HockeyStack multi-touch attribution — HockeyStack Docs, verified August 13, 2026
- HockeyStack attribution models — HockeyStack Docs, verified August 13, 2026
- HockeyStack attribution lookback — HockeyStack Docs, verified August 13, 2026
- HockeyStack lift analysis versus multi-touch attribution — HockeyStack Docs, verified August 13, 2026
- HockeyStack Data Syncs — HockeyStack Docs, verified August 13, 2026
- HockeyStack data import preparation — HockeyStack Docs, verified August 13, 2026
- HockeyStack implementation scope — HockeyStack Docs, verified August 13, 2026
- HockeyStack warehouse implementation scope — HockeyStack Docs, verified August 13, 2026
- HockeyStack integrations — HockeyStack, verified August 13, 2026
Official Mixpanel product and documentation sources
- Mixpanel platform — Mixpanel, verified August 13, 2026
- Mixpanel reports — Mixpanel Docs, verified August 13, 2026
- Mixpanel data model — Mixpanel Docs, verified August 13, 2026
- Mixpanel Group Analytics — Mixpanel Docs, verified August 13, 2026
- Mixpanel autocapture — Mixpanel Docs, verified August 13, 2026
- Mixpanel Android SDK — Mixpanel Docs, verified August 13, 2026
- Mixpanel Swift SDK — Mixpanel Docs, verified August 13, 2026
- Mixpanel Session Replay — Mixpanel, verified August 13, 2026
- Mixpanel experiments — Mixpanel, verified August 13, 2026
- Mixpanel Experiment Report packaging — Mixpanel Docs, verified August 13, 2026
- Mixpanel Feature Flags packaging — Mixpanel Docs, verified August 13, 2026
- Mixpanel Warehouse Connectors — Mixpanel Docs, verified August 13, 2026
- Mixpanel export methods — Mixpanel Docs, verified August 13, 2026
- Mixpanel Data Pipelines — Mixpanel Docs, verified August 13, 2026
- Mixpanel changelog — Mixpanel Docs, verified August 13, 2026
Pricing and customer-review sources
- HockeyStack pricing — HockeyStack, verified August 13, 2026
- Mixpanel pricing — Mixpanel, verified August 13, 2026
- HockeyStack rating and review count on G2 — G2, verified August 13, 2026
- HockeyStack review themes on G2 — G2, verified August 13, 2026
- Mixpanel rating and review count on G2 — G2, verified August 13, 2026
- Mixpanel review themes on G2 — G2, verified August 13, 2026
Videos, measurement, and causality sources
- HockeyStack Demo — HockeyStack on YouTube, published October 10, 2022; availability verified August 13, 2026
- Mixpanel Demo | Self-Serve Digital Analytics in Action — Mixpanel on YouTube, published August 25, 2025; availability verified August 13, 2026
- Drawing Causal Inference from Big Data — Microsoft Research, accessed August 13, 2026
- Pitfalls of Long-Term Online Controlled Experiments — Microsoft Research, accessed August 13, 2026
Hymetry product context
- Hymetry Companies — Hymetry, verified August 13, 2026
- Hymetry Users — Hymetry, verified August 13, 2026
- Hymetry Pages — Hymetry, verified August 13, 2026
- Hymetry Visits — Hymetry, verified August 13, 2026
- How to measure product usage by company — Hymetry, verified August 13, 2026