What is a product area?
A product area is a stable collection of related capabilities, grouped pages, and workflows that serve a coherent customer or administrative purpose. Reporting, Collaboration, Integrations, Administration, Billing, Data Management, and User Management are common examples.
When teams ask how to measure product adoption above the feature level, they often need this middle layer. Depending on the product’s terminology, they may describe it as product module adoption, feature group adoption, or product capability adoption. The label matters less than the grouping rule and the question it supports.
The word stable matters. A useful product area should survive routine interface changes, URL changes, and navigation redesigns. The product may move a button or rename a menu item while the underlying customer job remains the same.
The word coherent matters too. A product area should help a team ask a meaningful analytical question, such as:
- Which eligible accounts have adopted Reporting?
- Is Collaboration used by several people or only one champion?
- Which accounts connected and repeatedly used an Integration?
- Did newly onboarded accounts complete the Administration setup needed for the rest of the product?
A product area is not automatically the same as the interface
A product area is not simply:
- a navigation menu item;
- a visual section of the interface;
- every URL that shares a prefix;
- a marketing category;
- an arbitrary color group.
Those structures can be useful inputs, but they are not sufficient definitions. A menu may be redesigned. One customer job may cross several screens. A URL prefix may contain unrelated tasks. A marketing category may be too broad to support a product decision.
| Possible starting point | Why it is not enough by itself | Validation question |
|---|---|---|
| Navigation label | Navigation reflects information architecture, not necessarily one complete customer job. | Would the area still make sense after a navigation redesign? |
| URL prefix | Shared paths may contain setup, detail, administration, and unrelated actions. | Do all included paths contribute to the same analytical question? |
| Team ownership | Internal ownership can change and may cut across the customer experience. | Would a customer or customer-facing team understand the grouping? |
| Marketing module | Commercial packaging can be broader or narrower than actual product behavior. | Can the module be measured with coherent eligibility and qualifying behavior? |
A practical product-area hierarchy
A useful hierarchy separates the strategic overview from the evidence underneath it:
Product area → Grouped page or feature → Normalized raw page → Event or action
Consider the Reporting product area.
Product area: Reporting
The product-area level answers broad questions: How many eligible accounts adopted Reporting? Is adoption increasing? Which account segments use it? How much of the area has each account adopted?
Grouped pages or features
- Reports list;
- Report builder;
- Report details;
- Scheduled reports;
- Exports.
The grouped-page or feature level is where a team compares adoption inside the area. It can reveal that accounts discover Reports but rarely reach Scheduled reports, or that Exports are common while Report builder use remains shallow.
Normalized raw pages
/reports;/reports/new;/reports/:report_id;/reports/:report_id/schedule.
Normalized raw pages preserve exact route evidence without treating every dynamic report ID as a different feature. They are useful for path rules, page-specific actions, and investigation.
Events or actions
report_created;report_exported;report_schedule_created.
Events identify what happened. They are often the strongest basis for meaningful-action or workflow-completion thresholds, but one event does not necessarily describe the full area.
| Level | Best question | Main strength | Main limitation |
|---|---|---|---|
| Product area | Which broad capabilities have accounts adopted? | Stable strategic overview | Can hide differences between workflows |
| Grouped page or feature | Which part of the area drives or blocks adoption? | Actionable feature-level comparison | May still combine several raw paths or actions |
| Normalized raw page | Which exact route or state was involved? | Precise page evidence without dynamic-ID noise | Too granular for broad adoption reporting |
| Event or action | What did the user actually do? | Strong behavioral evidence | May represent only one step in a larger job |
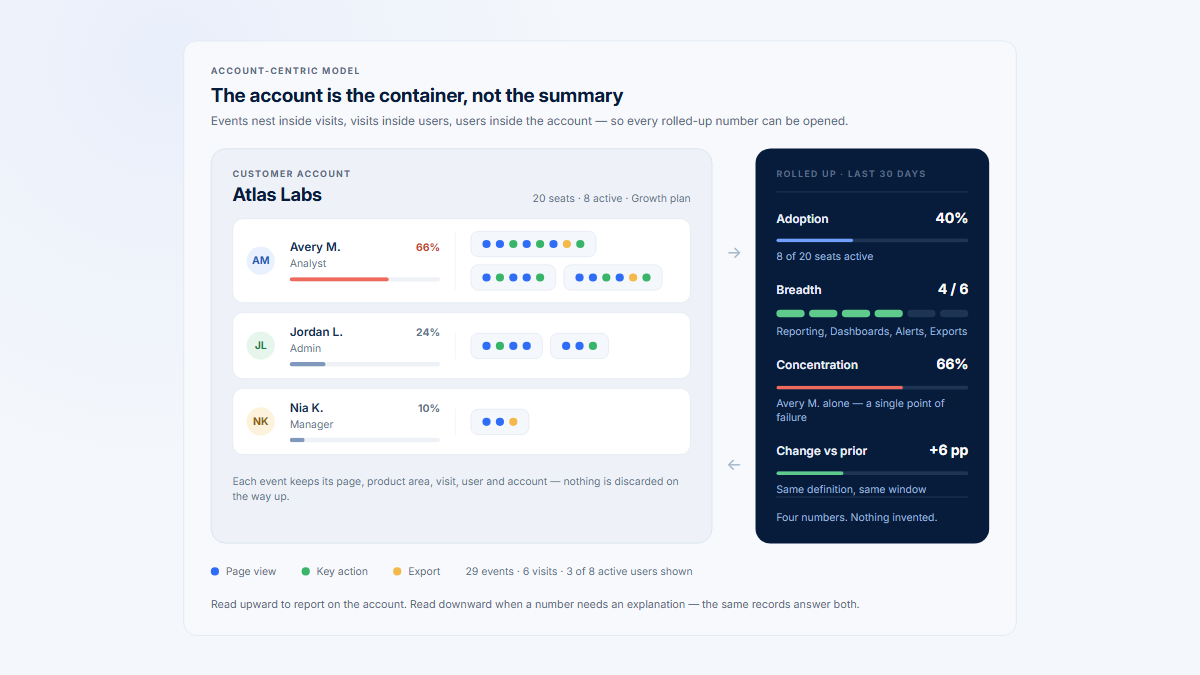
This hierarchy complements a broader account-centric B2B product analytics model: the product area gives the overview, while companies, users, and Visits explain the result.
How to define useful product areas
Start with customer jobs and administrative responsibilities, not the analytics tool. A useful area normally meets the following criteria.
- Coherent customer job
The grouped capabilities help a customer accomplish a recognizable outcome or responsibility. - Stable enough for period comparison
Routine UI and URL changes should not rewrite the area every month. - Understandable across teams
Product, customer success, account management, design, and leadership should interpret the label in approximately the same way. - Broad enough to group related behavior
The area should reduce noise from individual pages and events. - Narrow enough to preserve useful differences
An area called “Everything after login” is stable but analytically useless. - Compatible with role and eligibility rules
The team should be able to state who could use the area and under what configuration. - Traceable to underlying pages and events
Every aggregate should be explainable through the grouped pages, normalized raw pages, and actions that produced it. - Maintainable as the product changes
The taxonomy should have an owner, documented rules, and a process for adding, moving, and retiring features.
Should product areas overlap?
For primary reporting, prefer a clear hierarchy in which each grouped page or feature has one primary product area. This keeps account adoption, area breadth, and area-to-area comparison understandable.
Some products also need supporting tags. Search may be a cross-cutting capability. Permissions may affect Reporting, Collaboration, and Administration. Mobile support may span the whole product. Supporting tags can preserve that context without making every capability a member of several primary areas.
Choose an area-adoption threshold
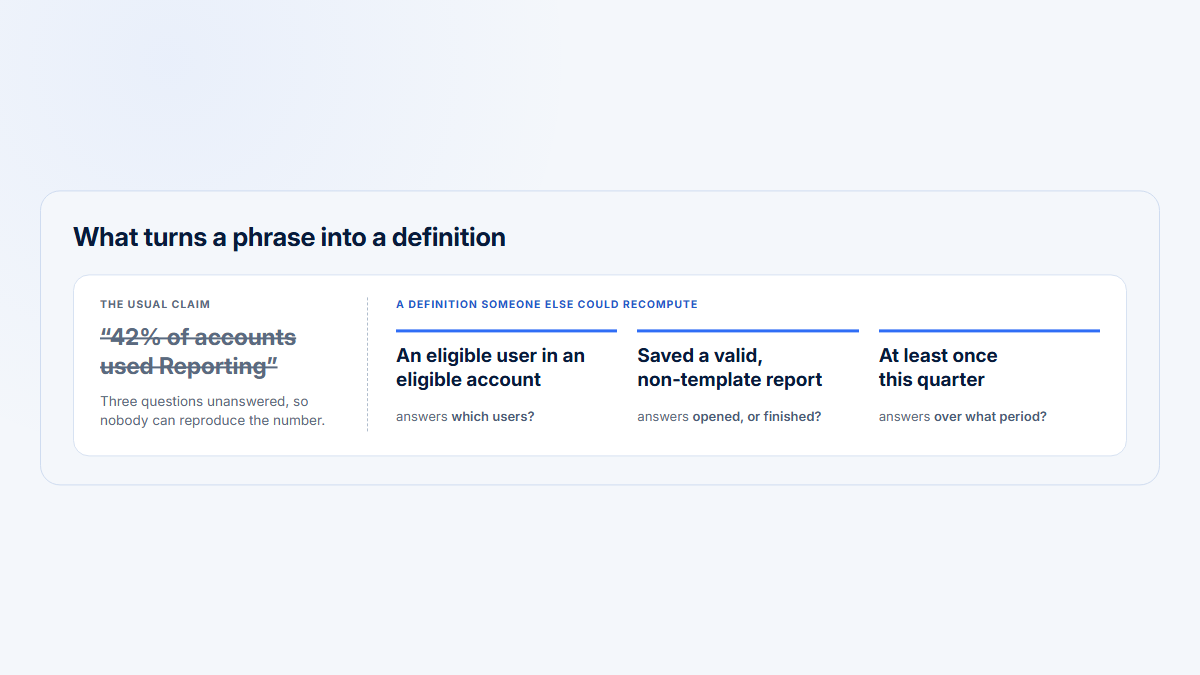
“Used the area” is not one universal condition. The threshold should match the analytical question. The same underlying behavior can support several valid product area analytics views.
Reach-based area adoption
An eligible account visited at least one grouped page in the area.
Useful for: discovery, visibility, navigation reach, and early release reach.
Main limitation: a page view may represent curiosity, accidental navigation, or an incomplete attempt rather than adoption.
Meaningful-action adoption
An eligible account completed at least one predefined meaningful action in the area, such as creating a report, exporting data, inviting a collaborator, or completing a configuration.
Useful for: initial workflow adoption and release validation. See the related guide to defining meaningful feature use.
Main limitation: one action can still be a trial rather than an established workflow.
Multi-feature adoption
An eligible account adopted a required minimum number of grouped features inside the area, such as three of five Reporting capabilities.
Useful for: broad modules with several independent but complementary features.
Main limitation: every feature may not be relevant to every account, so the available-feature denominator must respect plan, role, and configuration.
Recurring area adoption
An eligible account used the area in a required number of distinct Visits, days, weeks, months, or business cycles.
Useful for: workflows expected to recur, such as weekly reporting, monthly exports, or repeated collaboration.
Main limitation: the cadence must match the job. A quarterly workflow will look weak in a weekly recurrence metric.
Workflow-completion adoption
An eligible account completed a defined sequence within the area, such as opening a builder, configuring a report, saving it, and scheduling delivery.
Useful for: complex workflows where reaching one page or firing one event does not represent completion.
Main limitation: valid alternate paths and role handoffs can make a rigid sequence misleading.
| Threshold | Question answered | Evidence required |
|---|---|---|
| Reach | Did the account encounter the area? | Grouped-page or normalized-page activity |
| Meaningful action | Did the account complete at least one valuable step? | Predefined event or action |
| Multi-feature | How much of the module did the account adopt? | Feature-level adoption rules and availability |
| Recurring | Did use become repeated behavior? | Distinct Visits or time periods |
| Workflow completion | Did the account complete the intended sequence? | Ordered steps, completion event, or state change |
Do not choose a threshold only because it produces an attractive adoption rate. Name the question first, then select the evidence that answers it. For the narrower calculation, use the feature adoption rate framework at the grouped-feature level.
Core product-area adoption metrics
The formula is simple only after the definitions are explicit. Count distinct accounts and users across the complete selected period. Do not add daily unique counts to create a monthly total.
Account product-area adoption rate
= eligible active accounts meeting the area-adoption threshold
÷ eligible active accounts
× 100
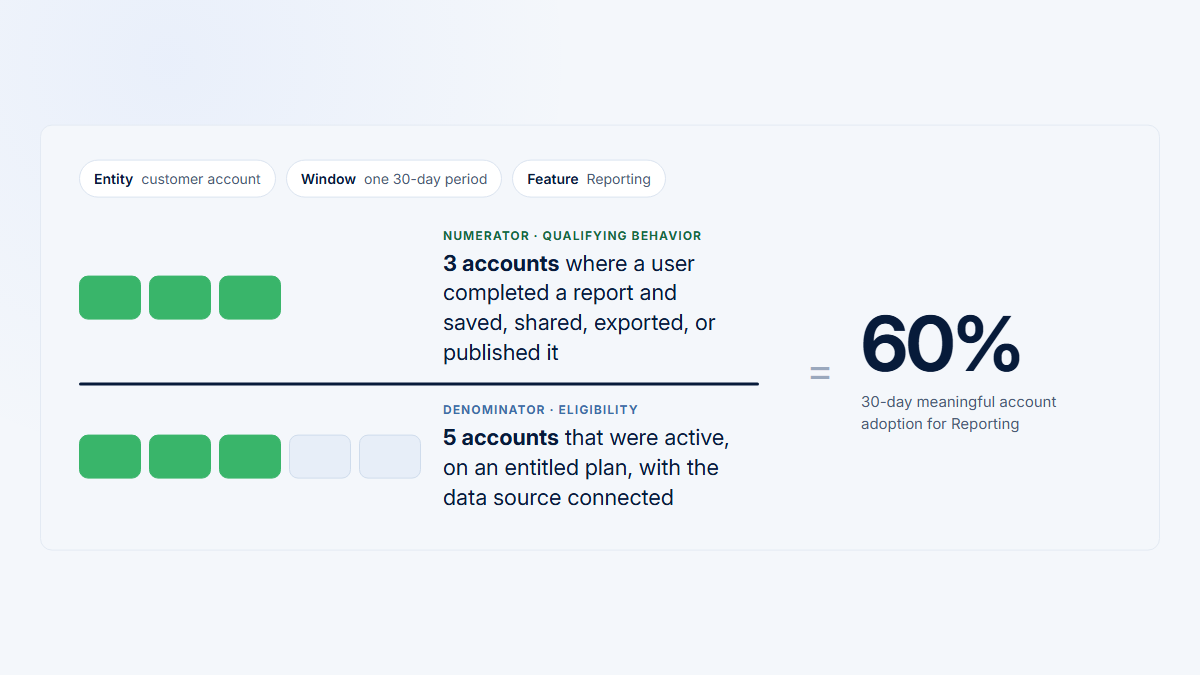
This is the headline reach or adoption metric. “Eligible,” “active,” “threshold,” and “period” must all be defined.
User penetration within adopting accounts
= distinct users using the product area
÷ active users within the accounts that adopted the area
× 100
User penetration shows whether adoption is distributed inside adopting accounts or concentrated among a small number of people.
Area breadth for an account
= grouped features adopted in the area
÷ relevant grouped features available to the account
× 100
Area breadth measures coverage within one area. The denominator should exclude features unavailable or irrelevant to that account under the stated model.
Recurring area adoption
= accounts using the area in the required number of distinct periods
÷ accounts that initially adopted the area
× 100
Recurring adoption separates initial use from repeated behavior. The required number of periods and their length depend on the area.
Optional diagnostic: top-user concentration
Top-user concentration
= area activity from the account’s top user
÷ total area activity in that account
× 100
Choose one activity basis—meaningful actions, Visits, or observed engaged time—and label it. Do not switch the basis between accounts or periods without making the change explicit.
Eligibility comes before the denominator
Every account should not appear in every product-area denominator. Specialized areas will look artificially weak when teams include customers who cannot or should not use them.
Eligibility may depend on:
- plan or entitlement;
- user role;
- account lifecycle or onboarding stage;
- completed setup;
- an enabled integration or prerequisite;
- industry or use case;
- whether the workflow is optional or core;
- feature release date;
- product configuration.
For example, an advanced Integrations area may be available only to accounts on a certain plan and only after an administrator enables a connector. An account without access should not lower adoption. An account with access but no connector configuration may be eligible for discovery but not yet eligible for recurring-sync analysis. The exact boundary depends on the question.
| Stage | Question | Example |
|---|---|---|
| Available | Does the product or plan expose the capability? | The account’s plan includes Reporting. |
| Eligible | Could this account reasonably perform the behavior in this period? | Reporting setup is complete and the area was released before the measurement window. |
| Reached | Did the account encounter the area? | A user opened a grouped Reporting page. |
| Adopted | Did the account meet the chosen threshold? | A user created, exported, or scheduled a report. |
| Recurring | Did the behavior repeat at the expected cadence? | The account completed a meaningful Reporting action in at least two distinct weeks. |
Keep the eligibility rule in the metric definition, dashboard tooltip, and analysis notes. When measuring product usage by company, retain the account attributes used to apply that rule so the denominator can be audited later.
Connect account adoption to user distribution
An account can meet an area-adoption threshold through one person. That may be appropriate or fragile depending on the area.
Billing and Administration may be intentionally owned by one administrator. Collaboration normally implies several participants. Reporting may be healthy with one analyst in a small account but risky in an enterprise account that depends on one champion. The account-level result must remain connected to:
- the number of participating users;
- their roles;
- user penetration;
- top-user concentration;
- backup champions;
- product-area breadth;
- active days;
- repeated Visits.
A useful review asks not only “Did this company adopt Collaboration?” but also “Which roles participate, how many people return, and what share of activity comes from the top user?”
Use the Companies view for the account result and the Users view for the people behind it. Product teams and customer teams can then distinguish valid specialization from a backup-champion gap.
Worked B2B example: Reporting adoption across five accounts
The following data is illustrative. The company names, actions, and percentages are fictional and are not customer evidence or benchmarks.
Assume a B2B SaaS product has four product areas: Reporting, Collaboration, Integrations, and Administration. The team defines a threshold and cadence for each area before looking at the results.
| Product area | Eligibility rule | Initial adoption threshold | Recurring expectation |
|---|---|---|---|
| Reporting | Plan includes Reporting and setup is complete | At least one report is created, exported, or scheduled | Meaningful use in at least two distinct weeks in a 30-day window |
| Collaboration | Account has at least two eligible users | At least two users complete a collaboration action | Collaboration activity in at least two distinct weeks |
| Integrations | Plan includes connectors and an administrator can configure them | A connection is created and produces at least one successful sync | A successful sync in the expected monthly or operational cycle |
| Administration | Account has an eligible administrator | A relevant team, role, permission, or configuration change is completed | Measured over a 90-day administrative cycle rather than weekly |
The account-by-area matrix below uses each area’s stated threshold and cadence. It is useful for scanning distribution, not ranking unlike workflows as though they had the same expected frequency.
| Account | Reporting | Collaboration | Integrations | Administration |
|---|---|---|---|---|
| Atlas Labs | Recurring | Recurring | Initial adoption | Adopted in 90-day cycle |
| Northstar Works | Initial adoption | Recurring | Not eligible | Adopted in 90-day cycle |
| Beacon Systems | Reach only | Initial adoption | Recurring | Adopted in 90-day cycle |
| Meridian Group | Not eligible | Recurring | Initial adoption | Adopted in 90-day cycle |
| Harbor Analytics | Not adopted | Reach only | Not eligible | Adopted in 90-day cycle |
Reporting evidence for the selected 30-day period
Reporting contains five grouped features: Reports list, Report builder, Report details, Scheduled reports, and Exports. For this example:
- Page reach means at least one Reporting grouped-page Visit.
- Meaningful action means creating, exporting, or scheduling a report.
- Reporting user means an active user with at least one Reporting page Visit or meaningful Reporting action.
- Top-user concentration is the share of the account’s Reporting Visits generated by its most active Reporting user.
- Recurring adoption requires a meaningful Reporting action in at least two distinct weeks.
| Account | Eligible? | Page reach? | Meaningful actions | Grouped features adopted | Active users | Reporting users | Top-user share of Reporting Visits | Repeated use | Status |
|---|---|---|---|---|---|---|---|---|---|
| Atlas Labs | Yes | Yes | 8 | 4 of 5 | 6 | 4 | 50% | Meaningful use in 3 weeks; 6 Visits | Recurring adoption |
| Northstar Works | Yes | Yes | 1 | 2 of 5 | 4 | 1 | 100% | Meaningful use in 1 week; 2 Visits | Initial adoption |
| Beacon Systems | Yes | Yes | 0 | 0 of 5 | 5 | 2 | 60% | Page reach in 2 weeks; no qualifying action | Reach only |
| Meridian Group | No; Reporting is unavailable on the current plan | No | 0 | 0 relevant features | 7 | 0 | — | — | Excluded from denominator |
| Harbor Analytics | Yes | No | 0 | 0 of 5 | 3 | 0 | — | No Reporting Visits | Not adopted |
1. Reporting account adoption
Four active accounts are eligible: Atlas Labs, Northstar Works, Beacon Systems, and Harbor Analytics. Atlas Labs and Northstar Works meet the meaningful-action threshold.
Meaningful-action Reporting adoption
2 ÷ 4 × 100 = 50%
2. Effect of changing the threshold
If the team defines adoption as any Reporting page reach, Atlas Labs, Northstar Works, and Beacon Systems qualify.
Reach-based Reporting adoption
3 ÷ 4 × 100 = 75%
Changing the threshold from any page viewed to a meaningful action reduces the reported rate from 75% to 50%, a difference of 25 percentage points. Neither number is inherently more correct. The reach rate answers whether accounts encountered Reporting; the meaningful-action rate answers whether they completed a qualifying Reporting action.
3. Reporting user penetration
The adopting accounts are Atlas Labs and Northstar Works. They have ten active users in total. Five distinct users used Reporting.
Reporting user penetration within adopting accounts
5 ÷ 10 × 100 = 50%
The global account result hides a large distribution difference. Atlas Labs has four Reporting users and a 50% top-user share of Visits. Northstar Works qualifies as adopted, but one person accounts for every Reporting Visit.
4. Reporting breadth for Atlas Labs
Atlas Labs adopted four of the five Reporting features available to it.
Atlas Labs Reporting breadth
4 ÷ 5 × 100 = 80%
This shows broad coverage inside Reporting. It does not show whether each feature is used deeply or whether Atlas Labs has adopted other product areas.
5. Recurring Reporting adoption
Two accounts initially adopted Reporting through a meaningful action. Only Atlas Labs used it meaningfully in at least two distinct weeks.
Recurring Reporting adoption
1 ÷ 2 × 100 = 50%
What should the team investigate next?
The area-level result identifies where to look, not why the pattern exists.
- Atlas Labs: inspect which one of the five grouped Reporting features remains unadopted and whether that gap is relevant.
- Northstar Works: determine whether one-person ownership is appropriate or whether the account lacks a backup user.
- Beacon Systems: inspect the Reports list and Report details Visits to understand why page reach did not lead to a meaningful action.
- Harbor Analytics: confirm eligibility, discoverability, onboarding state, and actual relevance before treating the absence as a problem.
- Meridian Group: keep the account out of the denominator unless plan availability changes.
This is why product-area analytics should retain the grouped-feature, company, user, and Visit layers underneath the aggregate.
Area breadth versus product-wide breadth
Several related metrics are often called “breadth.” Keep their scope explicit.
| Metric | Scope | Example question |
|---|---|---|
| Breadth inside one product area | Grouped features within Reporting | Did the account adopt one Reporting feature or most relevant Reporting features? |
| Breadth across product areas | Reporting, Collaboration, Integrations, Administration | How many relevant capabilities has the account adopted across the product? |
| Depth inside adopted features | Frequency, meaningful actions, completion, engaged behavior | How intensively or successfully is an adopted feature used? |
| Overall account adoption breadth | All relevant grouped pages or areas available to the account | How much of the relevant product does the account use? |
An account can deeply adopt Reporting while using little of the rest of the product. That may represent:
- strong focused fit;
- an expansion opportunity;
- expected specialization;
- incomplete onboarding;
- lack of relevance elsewhere.
Do not label the pattern automatically unhealthy. Interpret it against the account’s use case, plan, roles, lifecycle, and customer conversations. The dedicated guide to adoption breadth versus depth covers that distinction in more detail.
Measure product-area adoption over time
A current adoption rate is only one snapshot. Period-to-period movement shows whether an area is spreading, holding, softening, or returning.
- Newly adopted area
The account meets the area threshold in the current period but did not meet it in the comparable previous period. - Retained adopted area
The account meets the threshold in both periods. - Dropped area
The account met the threshold previously but does not meet it in the current period. - Returning area
The account meets the threshold again after one or more periods without qualifying use.
Useful time-based metrics include:
- current versus previous account adoption;
- percentage-point change in the adoption rate;
- newly adopted, retained, dropped, and returning accounts;
- active days in the area;
- recurring adoption;
- time to first meaningful area use after eligibility begins.
Use comparable periods
Current and previous periods should normally have the same length and comparable opportunity. A 30-day period should not be compared with a 14-day period without adjustment. Release dates, holidays, billing cycles, and incomplete periods can also change the opportunity to use an area.
Match the window to the cadence
Daily collaboration may be evaluated weekly or monthly. Monthly financial reporting needs a longer window. Quarterly Administration or compliance work may be better measured by business cycle than by calendar month.
A low-frequency area can be healthy even when it is absent from a short window. The measurement period should give eligible accounts a realistic opportunity to perform the expected job.
Handle changes to product-area definitions
Product-area analytics depends on classification rules. When those rules change, historical trends can change even if customer behavior does not.
Suppose Exports moves from Reporting to Data Management. Reporting adoption and breadth may fall, while Data Management rises. A chart can make that look like a behavioral shift when only the taxonomy changed.
Use stable identifiers separate from labels
Keep a stable internal ID such as area_reporting separate from the display label. Renaming “Reports” to “Reporting” should not create a new analytical entity.
Version material rule changes
Store a rule or taxonomy version when grouped pages, features, or eligibility logic materially change. Record effective dates so a team can explain which definition applied to each period.
Choose a history strategy deliberately
Possible strategies include:
- recalculating history under the new taxonomy;
- preserving historical classifications as originally reported;
- showing old and new classifications in parallel for a transition period;
- using a documented bridge that maps old areas to new areas.
No one strategy is correct for every product. Recalculation improves comparability under the current model but can rewrite previously reported numbers. Frozen history preserves what teams saw at the time but can make long-term analysis harder after a major redesign.
Visualize product-area adoption clearly
No single chart can represent reach, meaningful use, breadth, user distribution, recurrence, and health at once. Choose a visual for a specific question and keep the underlying table available.
Area-level adoption bars
Use bars to compare adoption rates across areas. Label the denominator and threshold. If areas have different eligible populations, display the eligible-account count rather than implying that every bar uses the same base.
Account-by-area matrix
Use a matrix to show which accounts have recurring, initial, reach-only, not-adopted, or not-eligible status. Include an accessible data table and a legend. Do not use color as the only signal.
Treemap using engaged time
A treemap can show where observed engaged time is distributed across product areas and grouped pages. Rectangle size, color, and metric must be labeled clearly. A treemap of engaged time is not an adoption chart unless adoption is separately encoded and explained. Do not ask a treemap alone to represent adoption, depth, and health simultaneously.
Adoption profile
A compact profile can place related measures side by side: reach, meaningful-action adoption, average or median area breadth among adopters, user penetration, and recurrence. Keep them as separate labeled measures rather than blending them into one unexplained score.
Trend and distribution views
Use line or bar trends for current versus previous adoption, newly adopted accounts, retained adoption, and recurrence. Pair them with:
- an underlying grouped-page table;
- account distribution;
- user penetration;
- top-user concentration;
- links to relevant users and Visits.
The overview should make the next investigation easier, not conceal the evidence behind decorative encoding.
A practical implementation process
-
Map customer jobs
List the recurring customer and administrative responsibilities the product supports. Use product, success, support, and research knowledge rather than relying only on navigation.
-
Define stable product areas
Create the smallest set of broad, understandable areas that supports useful analysis without flattening important differences.
-
Assign grouped pages and meaningful events
Map normalized raw pages into grouped pages or features, then connect the actions that represent progress in each workflow.
-
Define eligibility for each area
Document plan, role, lifecycle, setup, release date, and configuration rules before calculating the denominator.
-
Select the area-adoption threshold
Choose reach, meaningful action, multi-feature use, recurrence, workflow completion, or another explicit rule that answers the intended question.
-
Select the period and expected cadence
Give accounts a realistic opportunity to use the area. Use business-cycle windows for low-frequency work.
-
Calculate account adoption
Count distinct eligible active account IDs across the complete period. Keep numerator and denominator visible.
-
Inspect user distribution and concentration
Review participating users, roles, penetration, top-user concentration, and backup champions inside adopting accounts.
-
Measure breadth and recurrence
Separate how much of the area was adopted from whether use repeated at the expected cadence.
-
Drill into grouped pages and Visits
Use the area result to select the feature, company, user, and session evidence worth reviewing rather than browsing raw events or recordings at random.
-
Validate against known workflows
Test the classification and thresholds against real product paths, role expectations, account configurations, and known edge cases.
-
Version taxonomy changes
Assign ownership, stable IDs, effective dates, and a migration strategy before moving or renaming features.
This process gives product teams a stable adoption overview and gives customer success teams an account-level path to the users and evidence behind it.
Common product-area adoption mistakes
| Mistake | What it distorts | Better approach |
|---|---|---|
| Using navigation labels as the taxonomy without validation | Confuses interface structure with customer jobs | Validate areas against coherent analytical questions and workflows |
| Counting every raw URL as a feature | Fragments one workflow across dynamic paths | Normalize URLs and group related pages before area analysis |
| Treating one page view as meaningful area adoption | Confuses reach with completed behavior | Label reach separately or require a meaningful action |
| Including irrelevant areas in every denominator | Makes specialized modules look artificially weak | Apply explicit plan, role, lifecycle, setup, and configuration eligibility |
| Making areas so broad that the result is not actionable | Hides which workflow changed | Keep grouped-feature evidence and split areas that answer unrelated questions |
| Making areas so narrow that they duplicate individual pages | Recreates URL or feature noise at the area level | Group related capabilities around a stable job |
| Double-counting overlapping primary areas | Inflates adoption and breadth | Use one primary hierarchy or document overlap and counting rules |
| Ignoring roles | Treats valid specialization and missing participation as the same pattern | Interpret adoption against administrators, contributors, viewers, and other eligible roles |
| Allowing one user to represent broad organizational adoption | Hides champion dependency | Pair account adoption with penetration, concentration, and backup users |
| Comparing areas with different cadence as if frequency were equivalent | Makes low-frequency areas look weak | Use area-specific windows and label cadence |
| Changing grouping rules without preserving comparability | Creates artificial trend movement | Use stable IDs, versions, effective dates, and documented migration choices |
| Summing daily unique companies for a period total | Counts the same account multiple times | Count distinct account IDs across the complete selected period |
| Interpreting engaged time as adoption without qualifying behavior | Confuses observed activity with completion or value | Use engaged time as context alongside a defined threshold |
| Treating area adoption as proof of health, value, or renewal | Overstates what behavioral evidence can establish | Use adoption as an investigation signal and retain customer and commercial context |
How Hymetry connects product areas to company and user evidence
Hymetry is account-centric product intelligence for B2B SaaS. Its Pages model keeps product structure at several levels: product areas, grouped pages or features, and normalized raw pages. That allows a product-area overview to remain stable while the underlying levels retain diagnostic detail.
A practical investigation path is:
Product area → Grouped page or feature → Companies → Users → Relevant Visits
At the product-area level, a team can see broad adoption, reach, engaged behavior, and distribution. At the grouped-page level, it can identify which workflow drives or limits the result. The Companies layer shows which accounts adopted the area and how broad or concentrated their usage is. The Users layer shows the people and roles behind each account result. Visits provides session-level evidence when a pattern needs deeper review.
This connection is important because a percentage alone cannot explain intent. A decline in Reporting may indicate friction, completed monthly work, a role change, a configuration issue, or a capability that is not relevant to that account. Hymetry helps teams move from the aggregate to the source views needed to investigate the difference.
Observed engaged time and repeated Visits can strengthen the evidence, but they do not automatically define adoption. Hymetry does not automatically know the correct customer job, eligible population, or adoption threshold for every product. The product team still needs to define and validate those rules.
Frequently asked questions
What is product area adoption?
Product area adoption is the share of eligible active accounts that meet a predefined usage threshold for a stable group of related pages, features, and workflows during a selected period. The definition should state the area, eligible population, qualifying behavior, and time window.
How is product-area adoption different from feature adoption?
Feature adoption measures one grouped feature or workflow. Product-area adoption summarizes several related features that support a broader capability or customer job. The area view is more stable for strategic comparison; the feature view is more precise for diagnosis.
Should product areas match the navigation menu?
Not automatically. Navigation can be a useful starting point, but a product area should remain meaningful after interface changes and should support a coherent analytical question. One customer job may span several menu items, while one menu item may contain unrelated tasks.
Can one feature belong to more than one product area?
It can, but the counting method must be explicit. For primary adoption reporting, one primary area per grouped feature is normally easier to interpret. Cross-cutting capabilities can use supporting tags. Overlapping primary areas can double-count adoption or breadth.
What denominator should I use for SaaS module adoption?
Use eligible active accounts: accounts that were active in the selected period and could reasonably use the module under the stated plan, role, lifecycle, setup, release-date, and configuration rules. Do not include every created account by default.
How many product areas should a B2B SaaS product have?
There is no universal number. Use the smallest stable set that is understandable across teams, broad enough to reduce page-level noise, and narrow enough to preserve useful workflow differences. Add or split areas only when the change supports a real analytical question.
How should I measure adoption for low-frequency product areas?
Use a longer or cycle-based window. Monthly reporting, quarterly administration, and annual compliance work should not be judged by a daily or weekly cadence. Give eligible accounts a realistic opportunity to perform the job and compare equivalent cycles.
Does product-area adoption prove customer value or renewal?
No. It proves only that the defined qualifying behavior occurred. Adoption can support an investigation into value, fit, health, risk, or expansion, but it does not independently establish satisfaction, intent, or a commercial outcome.
Sources
- Pendo, “Product areas.” https://support.pendo.io/hc/en-us/articles/360035612871-Product-areas
- Pendo, “Create a foundational data layer.” https://support.pendo.io/hc/en-us/articles/360046911712-Create-a-foundational-data-layer
- Pendo, “Core Events.” https://support.pendo.io/hc/en-us/articles/360049089172-Core-Events
- Pendo, “Product Engagement Score (PES).” https://support.pendo.io/hc/en-us/articles/360054782691-Product-Engagement-Score-PES
- Pendo, “View and manage tagged Features.” https://support.pendo.io/hc/en-us/articles/27370731453083-View-and-manage-tagged-Features
- Mixpanel, “Group Analytics: Group users together as an aggregated unit of measurement.” https://docs.mixpanel.com/docs/data-structure/group-analytics
- Mixpanel, “Govern Your Mixpanel Data for Long-Term Success.” https://docs.mixpanel.com/guides/guides-by-topic/govern-data
- Snowplow, “Introduction to tracking design.” https://docs.snowplow.io/docs/fundamentals/tracking-design-best-practice/
- Snowplow, “Versioning, patching, and marking schemas as superseded.” https://docs.snowplow.io/docs/fundamentals/schemas/versioning/
- PostHog, “Group analytics.” https://posthog.com/docs/product-analytics/group-analytics
- PostHog, “Retention.” https://posthog.com/docs/product-analytics/retention
- Amplitude, “Every Product Needs a North Star Metric: Here’s How to Find Yours.” https://amplitude.com/blog/product-north-star-metric