Menu
Instrumentation and self-hosting

Self-Hosted Product Analytics: A Decision Guide for SaaS Teams

Compare managed, self-hosted, and hybrid product analytics across data control, architecture, cost, security, reliability, staffing, and long-term maintenance.

Managed, self-hosted, warehouse-native, and hybrid analytics

The phrase “self-hosted analytics” is often used too broadly. Before comparing options, define the implementation boundary: who operates collection, storage, processing, query infrastructure, the product UI, security controls, backups, upgrades, and on-call support?

That boundary matters more than the label attached to the product.

Managed product analytics

In a managed product analytics service, a vendor operates most of the infrastructure and application layers. The vendor usually runs event intake, storage, transformations, analytical queries, dashboards, updates, and service monitoring.

The customer still owns important work:

  • deciding what to measure;
  • implementing browser, mobile, server, or API instrumentation;
  • providing stable user and account identities;
  • maintaining the product taxonomy;
  • minimizing sensitive-data capture;
  • validating whether dashboards answer the intended questions;
  • managing access and vendor governance;
  • planning exports and an eventual exit.

Managed does not mean responsibility-free. It means that a substantial portion of platform operation is included in the service relationship.

Fully self-hosted product analytics

In a fully self-hosted model, the organization operates the collection, storage, processing, query, UI, security, backup, upgrade, and support layers.

The software may arrive as an open-source application, a commercially licensed package, or an internal build. In every case, the organization running it must decide how it will be deployed, scaled, monitored, restored, patched, and supported.

Installing the application is the beginning of the operating responsibility, not the end.

Warehouse-native analytics

Warehouse-native analytics keeps behavioral data and much of the analytical model inside an existing warehouse or lakehouse. Teams analyze it through internal BI, SQL, notebooks, or a connected product-analytics application.

This model can make the warehouse the durable analytical source of truth, but it does not remove the need to build:

  • event contracts;
  • identity and company models;
  • Visit or session logic;
  • page and feature normalization;
  • incremental transformations;
  • period-level distinct calculations;
  • dashboards or an investigation interface;
  • access, retention, deletion, and data-quality controls.

A warehouse is a powerful substrate. It is not automatically a complete product analytics experience.

Hybrid analytics

A hybrid implementation deliberately splits operational ownership. Examples include:

  • self-hosted collection and storage with a managed analytical UI;
  • managed collection with raw-event export to a warehouse;
  • self-hosted product analytics with managed replay;
  • local identity resolution and privacy filtering with managed aggregation;
  • short detailed retention in an operational analytics store and long aggregate retention in a warehouse;
  • warehouse-native account analytics with a separate session-replay service.

Hybrid is not a compromise by default. It can be the most precise way to keep the layers that require control while outsourcing layers that would create disproportionate operational burden.

Open source and operational ownership are separate decisions

Open source describes access to and rights over software under a particular license. Self-hosting describes who operates the service.

An open-source product can have both a vendor-hosted and a self-managed edition. A closed-source application can be distributed for private deployment. A team can also self-host an open-source collector while purchasing a managed query or visualization layer.

Ask two separate questions:

  1. What software rights and extensibility do we need?
  2. Which operational responsibilities are we prepared to own?

Responsibility by deployment model

Responsibility by deployment model
Layer Managed Fully self-hosted Warehouse-native Hybrid
Instrumentation and event design Customer Customer Customer Customer
Collection service Mostly vendor Customer Customer or existing data platform Split
Raw storage Mostly vendor Customer Customer warehouse or object store Split
Identity and company modeling Shared, with customer supplying context Customer Customer Split
Visits, transformations, and aggregates Mostly vendor Customer Customer data team Split
Query infrastructure Vendor Customer Customer warehouse Split
Product UI Vendor Customer-operated application BI, internal UI, or connected application Split
Security configuration and access governance Shared Customer Customer Shared
Backups, upgrades, and platform monitoring Mostly vendor Customer Customer data-platform team Split
Incident response and on-call Vendor plus customer escalation Customer Customer Explicitly divided

The word “shared” should never remain vague in a contract or architecture document. Define who detects an incident, who can inspect the relevant data, who communicates status, and who performs recovery.

What a product analytics system actually contains

A production product analytics system contains much more than an endpoint and an events table.

Reference architecture for self-hosted product analytics, from event sources and ingestion through raw storage, identity, Visits, aggregates, query services, dashboards, replay, monitoring, retention, and recovery.
The main analytical path and replay path share identity and Visit context, while governance, observability, retention, and recovery apply across the system.

A practical reference architecture includes the following components.

1. Browser, server, mobile, and API event sources

Product behavior may arrive from multiple environments. Each source has different delivery, identity, connectivity, privacy, and versioning constraints.

Browser events can be blocked or lost. Mobile clients may remain offline. Server events can arrive without page context. API activity may belong to a service account rather than a human user.

2. Ingestion API

The ingestion layer accepts events, validates basic request structure, assigns receipt metadata, and returns an explicit acceptance or rejection result.

It should be designed for batching, retries, rate limits, and partial failure rather than assuming one request always contains one valid event.

3. Authentication and project routing

Every request must be associated with the correct project or tenant boundary. Authentication credentials, project identifiers, origin restrictions, and routing rules determine where data is allowed to go.

A routing mistake can create both a data-quality failure and a security incident.

4. Queue or stream

A queue or durable stream decouples event intake from enrichment and storage. It can absorb bursts, support retries, and prevent a slow downstream database from immediately taking the collector offline.

It also creates new operating concerns: lag, retention, dead-letter handling, replay, partitioning, and consumer coordination.

5. Raw-event storage

Raw storage preserves validated source events and the metadata required for reprocessing, audits, exports, and model changes.

A raw store should not be treated as an unlimited dumping ground. Its schema, access controls, retention, compression, and deletion behavior require deliberate design.

6. Identity resolution

Identity logic connects anonymous activity, identified users, merged identities, and account context. It must define which identifiers are stable and which attributes may change.

This layer is foundational. Incorrect identity produces incorrect distinct counts and misleading account histories.

7. Company or group modeling

B2B analytics associates activity with a company, account, tenant, or operating group rather than analyzing only individuals.

The model must handle multi-account users, sub-workspaces, account changes, service accounts, and historical membership.

8. Session or Visit construction

Raw events are grouped into Visits using explicit sessionization rules. The resulting model can support duration, ordered paths, interaction clusters, engaged time, and links to replay.

Sessionization must account for timeouts, midnight boundaries, late events, multiple tabs or devices, and server-side events that do not naturally belong to a browser session.

9. Page and feature normalization

Dynamic URLs and implementation-level event names are mapped into stable analytical concepts.

A useful hierarchy is:

Raw URL
→ normalized page
→ grouped page or feature
→ product area

This lets teams analyze “Task details” or “Reporting” instead of thousands of identifier-specific paths.

10. Daily or incremental aggregates

Incremental models calculate commonly requested metrics without scanning the complete raw history for every dashboard load.

Useful grains may include:

  • page by day;
  • company by day;
  • user by day;
  • company and page by day;
  • user and page by day;
  • product area by day;
  • Visit summaries.

11. Analytical query layer

The query layer combines current filters, eligible populations, period comparisons, distinct entities, taxonomy rules, and aggregate tables into reproducible metrics.

This may be implemented in an analytical database, warehouse, application service, semantic layer, or combination of those components.

12. Cache

A cache reduces repeated work for dashboards, common date ranges, saved segments, and high-cost account queries.

Cached results need versioning, invalidation, bounded retention, project isolation, and a recovery path when the cache is empty or unavailable.

13. Product UI and dashboards

The interface turns analytical models into decisions. It must expose definitions, filters, comparison periods, source evidence, empty states, data freshness, and limitations.

Building a trustworthy analytical UI is separate work from building the underlying database.

14. Export

Customers and internal teams may need raw events, modeled entities, aggregates, replay references, or deletion records outside the primary application.

Export design influences portability, incident investigation, compliance work, and migration options.

15. Retention and deletion

Retention rules determine when raw events, replay data, aggregates, caches, logs, and backups expire.

Deletion must propagate across every relevant representation. Removing one row from the primary database is not necessarily complete deletion.

16. Access control

Access should follow the tenant model and the principle of least privilege. Administrative access, support access, service credentials, exports, and replay often require different permissions.

17. Monitoring and data-quality checks

Operational monitoring asks whether the service is running. Data-quality monitoring asks whether the accepted data is complete, correctly identified, timely, and analytically valid.

Both are required.

18. Backup and disaster recovery

Backups need encryption, retention, access controls, restoration procedures, and regular recovery tests.

A successful backup job does not prove that the application can be restored within its required recovery objectives.

A raw events table addresses only one part of this architecture. It does not by itself provide trustworthy account analytics, stable product structure, interactive performance, privacy controls, or an investigation workflow.

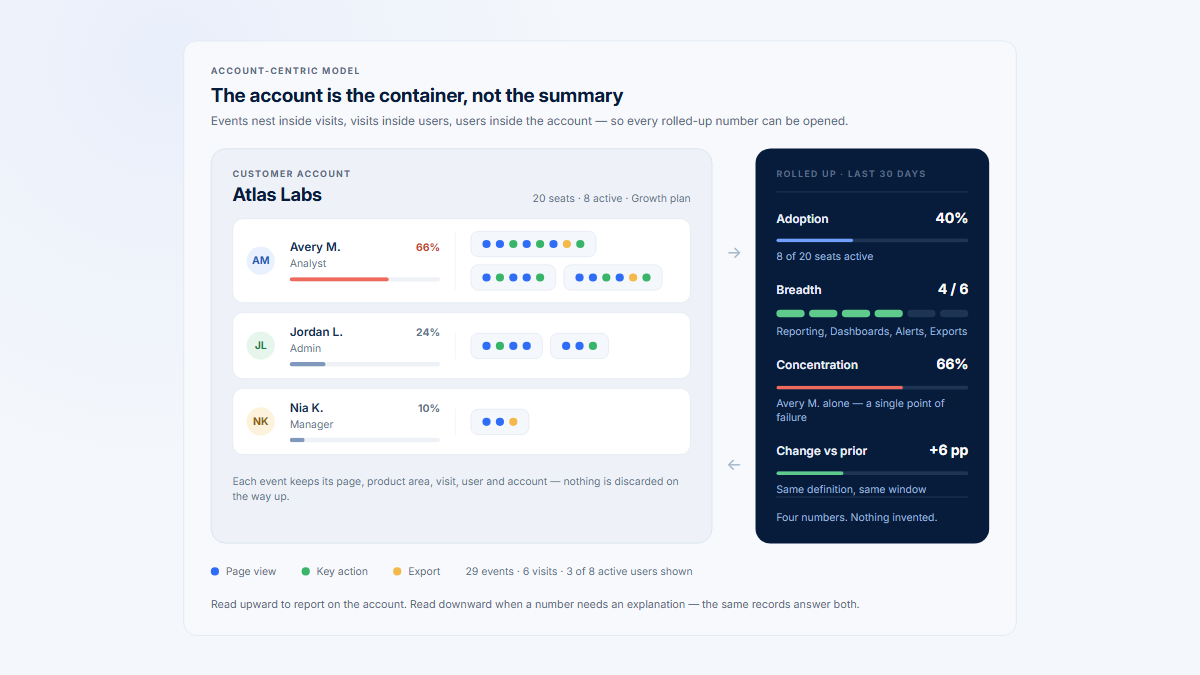
For a deeper account-level architecture perspective, see How to Analyze Product Usage by Company.

The B2B entity model

B2B product analytics needs to preserve the relationship between customer accounts, the people inside them, and the parts of the product they can use.

A practical implementation may contain the following entities.

The B2B entity model
Entity Purpose Common correctness risk
Project Separates products, applications, modules, or environments Mixing production, staging, or unrelated products
Company or account Represents the customer organization Using a mutable name instead of a stable ID
Workspace or operating group Represents a tenant, team, branch, or sub-account inside the analyzed SaaS product Treating every sub-workspace as an unrelated customer
User Represents an identified person or service identity Reusing emails or mutable attributes as primary identity
Membership Connects a user to a company or operating group over time Losing historical membership or assuming one user has one account
Event Records a behavior with time and context Missing IDs, inconsistent schemas, or incorrect account context
Visit Groups related activity into an ordered session Inconsistent sessionization or late-event handling
Normalized raw page Provides stable detail below a dynamic URL Failing to remove irrelevant identifiers
Grouped page or feature Represents a meaningful workflow Combining pages that answer different product questions
Product area Provides a stable high-level product structure Letting categories drift without history
Company attributes Support plan, lifecycle, region, size, owner, or custom segmentation Using current values to reinterpret all historical periods
User attributes Support role, team, permissions, or lifecycle analysis Capturing unnecessary personal data
Eligibility Defines who could reasonably adopt a feature in a period Using every active account as the denominator
Previous-period context Supports comparable trend and momentum analysis Comparing unequal periods or different eligible populations

In this generic model, “workspace” means an operating group inside the SaaS product being analyzed. It should not automatically be confused with an analytics platform’s own administrative workspace. In Hymetry, for example, a Hymetry workspace represents the customer organization managing one or more Hymetry projects.

Users and workspaces are often many-to-many

A user may:

  • belong to several customer workspaces;
  • move between teams;
  • work as a consultant across accounts;
  • administer a parent company and subsidiaries;
  • use both a personal and a company workspace;
  • appear temporarily through a support or implementation role.

Model that relationship through membership records rather than putting one permanent company_id on the user.

Where account context can change between actions, include the active account or operating-group identifier on the event. Preserve membership history so that a later change does not silently rewrite the meaning of earlier behavior.

For a current public treatment of the account relationship and its analytical records, see How to Analyze Product Usage by Company.

Build an intermediate analytical layer

A dependable product analytics application normally places modeled entities and aggregates between raw events and the UI.

Raw events
→ Visits
→ page, company, and user daily metrics
→ period-level queries
→ product UI

Each layer serves a different purpose.

Raw events preserve evidence

Raw events retain the original analytical detail needed for:

  • investigation;
  • reprocessing;
  • taxonomy changes;
  • export;
  • data-quality analysis;
  • exact event-property queries.

They are valuable precisely because they have not been reduced to a single dashboard interpretation.

Visits preserve sequence and session context

A Visit layer supports:

  • ordered page and event paths;
  • session duration;
  • engaged-time calculations;
  • interaction counts;
  • entry and exit context;
  • replay references;
  • account and user investigation.

Trying to reconstruct these relationships inside every dashboard query creates duplicated logic and inconsistent results.

Company-level rows support account questions

Company-level analytical rows make it possible to calculate:

  • distinct active companies;
  • account adoption;
  • adoption breadth;
  • account trends;
  • company-level product-area usage;
  • segment comparisons.

User-level rows support individual and penetration questions

User-level rows support:

  • distinct active users;
  • usage concentration;
  • user penetration inside adopting accounts;
  • champion dependence;
  • individual momentum;
  • user-to-account comparisons.

Daily rows make time-series charts and recent-period queries more efficient. Additive metrics such as validated event counts can often be summed across days.

Distinct entities require different treatment.

The exact period calculation is conceptually:

Period distinct companies =
COUNT(DISTINCT company_id)
over the complete selected interval

A system can accelerate this calculation using mergeable set states or probabilistic sketches. The important distinction is that it must merge the underlying distinct state. It cannot add already-finalized daily scalar counts.

Period-level queries apply the current analytical meaning

The period query layer should apply:

  • the selected date range;
  • the immediately preceding period of the same length;
  • project and account isolation;
  • current or historical taxonomy rules;
  • company attributes and saved segments;
  • eligibility rules;
  • exact or approximate distinct policy;
  • late-event policy;
  • timezone boundaries;
  • data-freshness indicators.

Without this layer, two screens can answer what appears to be the same question using different denominators or identity assumptions.

Event ingestion is a delivery system, not just an endpoint

A collector must remain predictable when clients retry, schemas change, traffic peaks, or downstream storage slows.

Client and server events

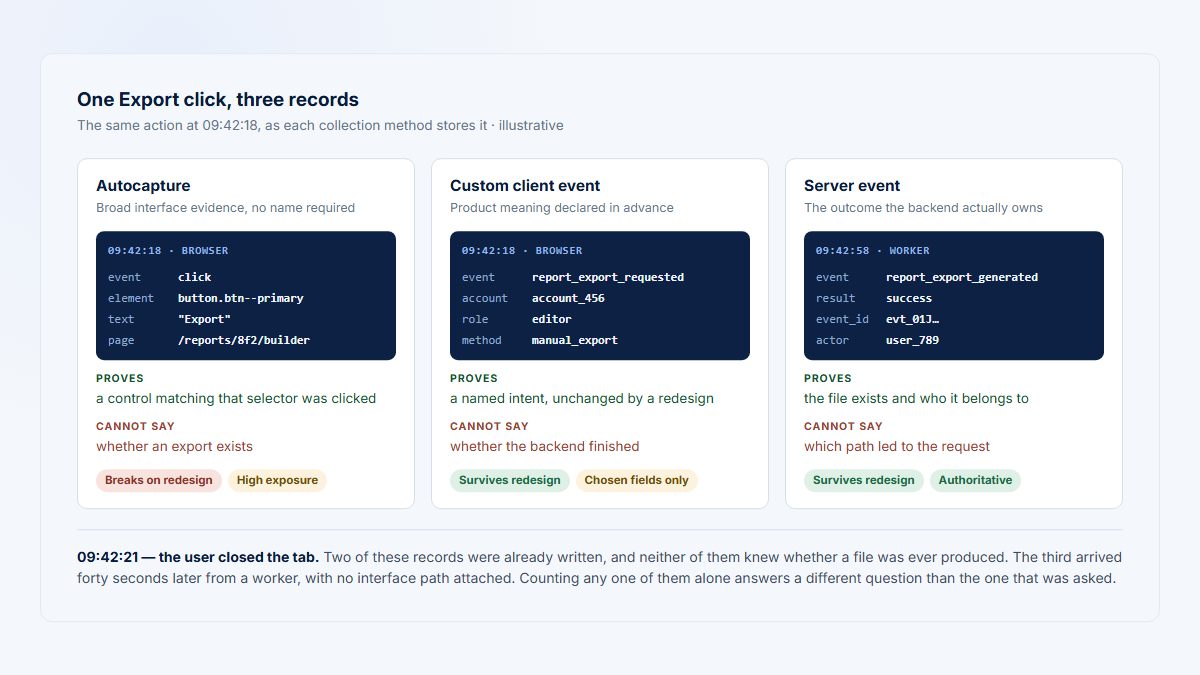
Client events provide interaction and page context but can be blocked, delayed, duplicated, or lost. Server events can be more reliable for completed business actions but may lack the screen and session context needed for behavioral analysis.

Use each source for the questions it can answer. Do not assume one stream automatically reconciles the other.

Batching

Batching reduces request overhead and can improve throughput, but larger batches increase the impact of partial failure.

The API should make it possible to identify which events were accepted, rejected, or should be retried.

Retries and deduplication

A retry can create a duplicate unless the event carries a stable event ID or another idempotency key.

A practical event record should distinguish:

  • event_id;
  • client occurrence time;
  • server receipt time;
  • source;
  • project;
  • user;
  • company or active account;
  • session or Visit context;
  • schema name and version.

Deduplication windows, storage, and collision behavior must be explicit.

Ordering and timestamps

Global event order is rarely realistic across browsers, servers, queues, and regions. Define the order that actually matters, such as order within a Visit or within one entity stream.

Preserve both occurrence and receipt timestamps. Establish a policy for:

  • clock skew;
  • late arrivals;
  • events arriving after an aggregate has been finalized;
  • timezone conversion;
  • backfills;
  • reprocessing.

Schema validation

Schema validation should reject or quarantine malformed events before they contaminate analytical models.

Version schemas rather than changing the meaning of an existing event name silently. Preserve rejected-event samples and rejection reasons without logging unnecessary sensitive values.

Rate limiting, authentication, and project routing

Protect the collector against accidental loops, invalid credentials, abusive clients, and one noisy project consuming shared capacity.

Rate limits should have observable responses. Project routing should be verified before data reaches shared processing or storage.

Backpressure

When downstream consumers cannot keep up, the system needs an intentional response:

  • buffer temporarily;
  • slow producers where possible;
  • reject with a retryable response;
  • degrade nonessential streams;
  • preserve critical semantic events;
  • alert operators before durable capacity is exhausted.

An unbounded in-memory buffer is not a backpressure strategy.

Regional endpoints

Regional collection can support latency or data-location requirements, but it adds routing, failover, deployment, observability, and consistency concerns.

A regional endpoint is meaningful only when the rest of the data path follows the required boundary.

Internal and test traffic

Mark and filter:

  • employees;
  • automated tests;
  • monitoring probes;
  • support sessions;
  • demo environments;
  • staging projects;
  • service accounts.

Do not rely on an analyst remembering to remove them from every query.

Privacy filtering

Filter or mask unnecessary sensitive data as early as possible. Once a value has entered queues, logs, raw storage, replicas, and backups, deletion becomes more complicated.

Replay may need a separate pipeline

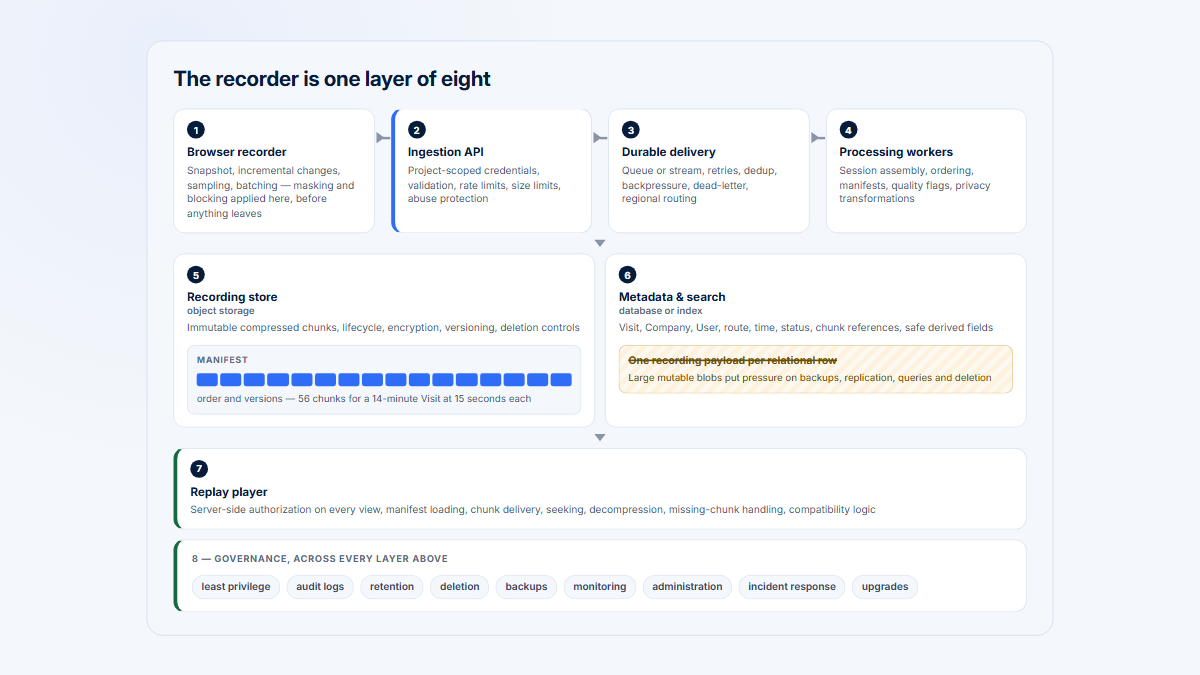
Session replay and high-frequency interaction capture can be substantially larger and more bursty than semantic product events.

The two streams can share identity, Visit, and project context while using different:

  • collection endpoints;
  • queues;
  • compression;
  • object storage;
  • retention;
  • access controls;
  • processing schedules;
  • failure priorities.

A replay outage should not necessarily prevent the ingestion of a critical semantic event. See Self-Hosted Session Replay: Architecture, Privacy, and Operations for the replay-specific infrastructure decision.

Choose storage by workload

No database is universally correct for product analytics. A system may use several storage types because ingestion, replay, interactive analysis, and export have different requirements.

Choose storage by workload
Component Useful role Important limitation
Relational database Application state, identity, configuration, moderate analytical workloads, transactional updates Large raw scans and high-cardinality aggregates may require careful indexing, partitioning, or another analytical layer
Columnar analytical database Append-heavy events, time-series scans, large aggregations, distinct counts Requires workload-specific ordering, partitioning, operational expertise, and data-model design
Object storage Compressed raw events, replay chunks, exports, backups, long retention Not an interactive query layer by itself
Data warehouse or lakehouse Durable cross-system analysis, transformations, historical models, governed data access Product-specific interactivity and investigation paths still need to be built
Search index Fast discovery across selected text or high-cardinality properties Usually unsuitable as the only source of analytical truth
Cache Low-latency repeated queries, saved segments, dashboard summaries Results can become stale and must be invalidated or rebuilt safely
Queue or stream Decoupling, burst absorption, replayable delivery, consumer coordination Adds lag, retention, partition, and recovery operations

Product analytics combines several workloads

The architecture may need to support all of the following:

  • append-heavy event ingestion;
  • distinct company and user queries;
  • time-series aggregation;
  • filtering by account attributes;
  • long raw-event retention;
  • shorter replay retention;
  • interactive dashboards;
  • high-cardinality event properties;
  • bulk exports;
  • backfills;
  • deletion requests;
  • current-period and previous-period comparisons.

Start from the questions, expected volume, correctness requirements, and operating capability. Do not choose a database first and then force the analytical model to fit it.

Query performance: freshness, exactness, and response time

A product analytics query often balances three goals:

  1. fresh data;
  2. exact answers;
  3. fast interactive response.

Achieving all three for every query can be expensive. Decide which property matters for each use case.

Raw-event scans

Raw scans provide flexibility and can support exact reprocessing, but their cost grows with volume, retention, selected properties, and concurrent use.

Reserve raw scans for questions that need raw detail or cannot be answered from a modeled layer.

Partitions and indexes

Date, project, and common filter boundaries can reduce scanned data when the storage engine and query pattern use them effectively.

Excessive partitions or indexes can create their own write, maintenance, and planning costs. Test the actual query workload rather than assuming more structures always improve performance.

Materialized views and pre-aggregation

Materialized or incremental views can move work from dashboard time to ingestion or background processing.

Good candidates include:

  • daily page metrics;
  • company activity summaries;
  • user activity summaries;
  • Visit-level metrics;
  • product-area trends;
  • reusable segment inputs.

Every aggregate should document its grain, refresh behavior, late-event handling, and whether it can answer period-level distinct questions correctly.

Incremental aggregation

Incremental jobs reduce repeated historical computation, but they need a strategy for:

  • late events;
  • corrected identities;
  • taxonomy changes;
  • deleted data;
  • failed batches;
  • replaying a source interval;
  • checking source-to-target completeness.

An incremental table without reconciliation can become a fast representation of incomplete data.

Exact and approximate distinct counts

Exact distinct counts are appropriate when the number is used for:

  • customer-facing account analysis;
  • small filtered cohorts;
  • validation;
  • billing or contractual logic;
  • parity checks.

Approximate algorithms can be useful for:

  • broad exploratory trends;
  • very high-cardinality dashboards;
  • rapid previews;
  • capacity-constrained interactive analysis.

The UI should not present an approximate number as exact. Document the algorithm, expected error characteristics, and whether states can be merged across days.

Project isolation

Project identity should be present throughout routing, storage, query, cache, export, and access-control logic.

Whether projects use logical isolation, separate schemas, separate databases, or separate infrastructure should follow the threat model and operating requirements. A project_id column alone is not a complete isolation design.

Account-attribute filters

Plan, region, lifecycle, owner, size, and custom attributes make B2B analysis useful, but they can create expensive joins and historical ambiguity.

Decide whether a query uses:

  • the attribute value at event time;
  • the value at the end of the period;
  • the current value;
  • a slowly changing history.

High-cardinality properties

Properties such as resource IDs, free text, URLs, and arbitrary customer metadata can multiply storage and query costs.

Collect a property because it supports a defined decision, not because the SDK can capture it.

Background cache rebuilds

Expensive reusable results can be rebuilt asynchronously after:

  • new data;
  • taxonomy changes;
  • saved-segment edits;
  • identity corrections;
  • deployment;
  • cache eviction.

Serve a clearly labeled stale result, a loading state, or a direct query according to the product’s freshness contract. Do not silently show an unrelated cached value.

Identity correctness comes before query speed

An optimized dashboard can still be wrong.

Use stable user IDs

Prefer an immutable application identifier over an email address, display name, or other attribute that can change or be reused.

Use stable company IDs

Company names, domains, plans, and lifecycle stages are attributes. They should not replace a durable company identifier.

Include active account context

A multi-account user may perform two consecutive actions for different companies. The event needs enough account context to assign each action correctly.

Define anonymous behavior

Decide whether anonymous activity:

  • remains anonymous;
  • is linked after identification;
  • is excluded from company-level analysis;
  • is retained for a shorter period;
  • can be merged across devices.

A merge should be auditable and reversible when feasible.

Preserve user merges and company renames

Identity corrections should not create duplicate historical users or move events without a trace.

Keep a merge history or canonical-identity mapping and define how aggregates are rebuilt.

Handle internal users and service accounts

Employees, bots, API integrations, and service accounts can make an account appear healthier or more broadly adopted than it is.

Classify them explicitly and decide which metrics include them.

Mark support impersonation

Support staff acting as a customer should not be interpreted as customer adoption. Record impersonation context and exclude it from standard behavioral metrics unless the analysis specifically needs it.

Preserve historical membership

A user leaving one company and joining another should not rewrite the account associated with earlier activity.

Fast queries built on incorrect identity can create confident but misleading product and customer-success decisions.

Maintain a versioned product taxonomy

Product analytics becomes more useful when implementation details are translated into stable product concepts.

Dynamic URL
→ normalized page
→ grouped page or feature
→ product area
→ meaningful event or workflow

For example:

/workspace/827/projects/128/tasks/993
→ /workspace/:id/projects/:id/tasks/:id
→ Task details
→ Project management

This structure supports analysis that remains understandable after route parameters and internal component names change.

Taxonomy rules need maintenance

Assign an owner for:

  • new routes;
  • renamed features;
  • merged workflows;
  • split workflows;
  • redirects;
  • deprecated product areas;
  • overlapping rules;
  • unmatched pages.

Preserve rule history

Changing a rule can have at least three legitimate meanings:

  1. apply the new definition only from now on;
  2. reprocess all history under the new definition;
  3. preserve both versions for comparison.

Choose deliberately. Silently rewriting history can make a release appear to change adoption when only the taxonomy changed.

For Hymetry’s current page-model terminology, see Pages Analytics. For event-selection tradeoffs, see Autocapture vs. Custom Events in Product Analytics.

Reliability requirements

When product, success, or leadership teams depend on an analytics system, it becomes an internal customer-facing product. If external customers can access the dashboards, the reliability obligation is even more direct.

Monitor the complete path rather than only host CPU and database availability.

Ingestion health

Track:

  • accepted events;
  • rejected events by reason;
  • authentication failures;
  • rate-limit responses;
  • duplicate rate;
  • request latency;
  • batch size;
  • payload size;
  • traffic by project and source.

Processing health

Track:

  • queue or stream lag;
  • consumer failures;
  • dead-letter volume;
  • late-event rate;
  • schema-validation failures;
  • identity-resolution failures;
  • Visit-construction delay;
  • aggregation delay;
  • source-to-model row reconciliation.

Serving health

Track:

  • query latency by screen and query class;
  • query errors;
  • cache hit rate;
  • stale-cache age;
  • background rebuild failures;
  • dashboard data freshness;
  • timeouts and cancelled queries;
  • concurrency and resource saturation.

Data integrity

Track:

  • unexpected gaps;
  • sudden event-volume changes;
  • missing company or user identity;
  • unmatched taxonomy rules;
  • impossible metric values;
  • changes in eligible denominators;
  • project cross-contamination tests;
  • differences between raw, modeled, and displayed totals.

Durability and governance

Track:

  • storage growth;
  • object count;
  • backup success;
  • restoration-test results;
  • replication health;
  • retention-job success;
  • deletion backlog;
  • export failures;
  • audit-log availability.

Deployment health

Track:

  • migration success;
  • worker-version consistency;
  • configuration drift;
  • dependency vulnerabilities;
  • rollback status;
  • post-deployment data parity.

Define service-level indicators for event acceptance, data freshness, query availability, deletion processing, and restore readiness. Set thresholds from business requirements and production testing rather than copying universal numbers from another system.

Security and privacy

Self-hosting changes the security boundary. It does not remove it.

A self-managed deployment may reduce exposure to an additional analytics provider, but it increases the organization’s direct responsibility for administrators, credentials, network configuration, patches, backups, logs, and incident response.

Encryption

Protect data in transit and at rest according to the deployment’s threat model.

Include:

  • client-to-collector traffic;
  • internal service traffic;
  • database volumes;
  • object storage;
  • queues;
  • exports;
  • backups;
  • administrative connections.

Encryption is only one control. Key access and rotation matter as much as the algorithm label.

Project and tenant isolation

Enforce isolation consistently in:

  • collection;
  • background jobs;
  • databases;
  • object keys;
  • caches;
  • exports;
  • replay;
  • logs;
  • support tools.

Test negative cases in which one project attempts to request another project’s data.

Least privilege

Separate the permissions needed by:

  • collectors;
  • consumers;
  • aggregation workers;
  • application servers;
  • support staff;
  • database administrators;
  • backup systems;
  • deployment automation.

Do not give every component broad database or object-storage credentials for convenience.

Audit logs

Audit security-relevant actions such as:

  • sign-in and administrative access;
  • permission changes;
  • project-key changes;
  • exports;
  • replay access;
  • retention changes;
  • deletion actions;
  • support impersonation;
  • secret rotation.

Keep sensitive event payloads out of general-purpose logs.

Authentication, SSO, and multifactor authentication

The required authentication controls depend on the risk and users of the deployment. Administrative and privileged access should receive stronger protection than a low-risk public view.

When SSO or MFA is a requirement, verify that the selected application and deployment actually support the necessary flow. Do not assume it because the software is self-hosted.

Data minimization and masking

Collect the smallest dataset that can answer a defined product question.

Apply masking, field exclusion, route exclusion, or property filtering before storage where possible. Replay requires particular care because page content and input values may contain information that semantic events do not.

Retention and deletion

Define retention separately for:

  • semantic events;
  • replay data;
  • modeled entities;
  • aggregates;
  • caches;
  • application logs;
  • audit logs;
  • exports;
  • backups.

A deletion workflow should find every representation it can remove. Backup policies may require data to age out rather than be edited in place; restoration procedures should prevent deleted data from silently returning to the active system.

Secret management

Do not place long-lived database passwords, project secrets, encryption keys, or third-party API keys in source control or shared configuration files.

Use an appropriate secret store, restrict access, rotate credentials, and log administrative changes without logging the secret value.

Environment separation

Production, staging, development, demos, and automated tests should use distinct projects and credentials. Prefer infrastructure separation when the risk justifies it.

Backup security

A well-protected primary database can still be exposed through an old unencrypted export or broadly accessible backup bucket.

Apply access controls, encryption, retention, deletion, and monitoring to backups.

Vulnerability management and dependency updates

Self-hosted software brings the application and its dependencies into the organization’s patching process.

Track:

  • operating-system updates;
  • language and framework dependencies;
  • database and queue versions;
  • container images;
  • transitive packages;
  • client SDKs;
  • known vulnerabilities;
  • unsupported versions.

Incident response

Prepare for incidents involving:

  • leaked project credentials;
  • cross-project access;
  • unwanted sensitive-data capture;
  • lost events;
  • corrupted aggregates;
  • compromised administrative accounts;
  • exposed backups;
  • unauthorized replay access.

Document containment, investigation, communication, recovery, and post-incident actions before an incident occurs.

Self-hosting can support a privacy strategy, but it is not a privacy guarantee. Privacy depends on what is collected, who can access it, where every copy goes, how long it is retained, and whether the system is operated correctly.

Staffing and long-term ownership

The question is not whether an engineer can install the software. It is whether a team can operate the resulting service for years.

Staffing and long-term ownership
Capability Ongoing work
Application engineering Product integration, authentication, UI changes, API compatibility, upgrades
Data engineering Event schemas, transformations, backfills, reconciliation, identity and taxonomy models
Database operations Capacity, indexes, partitions, replication, backups, restores, upgrades
Infrastructure Networking, deployment, scaling, queues, object storage, observability
Security Access reviews, secrets, vulnerabilities, incident response, threat modeling
Privacy and governance Minimization, retention, deletion, export, policy implementation
Frontend analytics UX Filters, definitions, tables, charts, drill-downs, loading and error states
Product analytics methodology Metric definitions, eligible populations, period comparisons, interpretation
On-call support Detection, triage, recovery, escalation, status communication
Documentation Runbooks, architecture, data contracts, ownership, recovery and migration procedures

One person may cover several capabilities. The responsibilities still exist.

Before choosing self-hosted product analytics, name the long-term owners for:

  • instrumentation;
  • identity and company modeling;
  • platform availability;
  • data correctness;
  • security;
  • privacy requests;
  • upgrades;
  • backup restoration;
  • on-call incidents;
  • product-facing analytical UX.

An unassigned responsibility becomes an incident waiting for the person who happens to notice it.

Calculate total cost of ownership

Comparing a managed subscription with a software license is not a valid cost comparison.

Use a complete annual model:

Annual product analytics TCO =
  ingestion compute
+ storage
+ analytical database
+ queue and cache
+ network transfer
+ backups
+ monitoring
+ security tooling
+ engineering maintenance
+ data-quality work
+ on-call and incident response
+ upgrades and migrations
+ compliance and governance

The same categories may be allocated differently in a managed product, but they do not all disappear.

A managed model should include:

Annual managed analytics TCO =
  subscription and usage charges
+ overages
+ export and network-transfer costs
+ instrumentation work
+ identity and taxonomy maintenance
+ data-quality validation
+ access and vendor governance
+ specialist analytical work
+ migration and exit preparation

Infrastructure inputs

Model at least:

  • events per day;
  • peak events per second;
  • average event size;
  • replay volume;
  • retention;
  • replicas;
  • indexes and storage overhead;
  • transformation compute;
  • concurrent queries;
  • cache size;
  • export volume;
  • backup copies;
  • high availability;
  • regional deployment;
  • network transfer.

Engineering inputs

Estimate recurring hours for:

  • maintenance;
  • upgrades;
  • migrations;
  • query optimization;
  • schema changes;
  • data-quality investigation;
  • support;
  • incident response;
  • security reviews;
  • backup and restoration tests;
  • retention and deletion;
  • documentation.

A simple labor input is:

Annual engineering maintenance cost =
  recurring engineering hours per year
× fully loaded hourly cost

Do not omit opportunity cost. Work spent operating analytics is work not spent on the SaaS product unless analytics infrastructure is itself a strategic capability.

Managed analytics can also become expensive

Managed pricing can rise with events, recordings, seats, retention, projects, or advanced features. A high-volume team should model managed and self-hosted options using the same traffic, retention, reliability, and staffing assumptions.

The correct conclusion may still be managed, self-hosted, warehouse-native, or hybrid. The purpose of TCO is to expose the tradeoff, not to predetermine it.

Total-cost model for product analytics including infrastructure, engineering, data quality, security, support, and governance.
Managed and self-hosted models allocate these costs differently; neither removes the need to account for them.

Capacity formulas

Capacity planning should begin before the production pilot.

Events per day =
  active users
× events per active user per day
Peak events per second =
  peak concurrent users
× average events per active user per second
Raw retained data =
  average compressed event size
× events per day
× retention days
× replication factor
Aggregate rows per day =
  projects
× active entities
× tracked analytical grains

For replay, add a separate estimate:

Replay retained data =
  average compressed recording size
× recordings per day
× replay retention days
× replication factor

These are planning formulas, not infrastructure guarantees.

Actual capacity depends on:

  • instrumentation scope;
  • batching and compression;
  • metadata and index overhead;
  • property cardinality;
  • account and user distributions;
  • late events and retries;
  • taxonomy complexity;
  • aggregate grains;
  • dashboard filters;
  • concurrent queries;
  • exports;
  • replication;
  • backups;
  • replay detail;
  • retention.

Treat the raw retained-data formula as a payload-level lower bound unless it includes database pages, indexes, metadata, temporary files, object versions, and operational headroom.

Measure average and peak traffic separately. A system sized only for the daily average can fail during a release, import, automated workflow, or retry storm.

Worked decision example

The following teams are fictional. Their traffic, storage, and decisions are illustrative and are not customer results, vendor benchmarks, or universal recommendations.

Requirements

Requirements
Requirement Team A Team B Team C
Company stage Early-stage B2B SaaS Established B2B SaaS Medium-sized B2B SaaS
Daily active users 600 18,000 8,000
Semantic events per active user per day 25 45 35
Estimated events per day 15,000 810,000 280,000
Desired semantic-event retention 90 days 730 days 365 days
Replay Limited evaluation 3,000 recordings per day, 30-day detailed retention Needed for selected workflows
Data team None Experienced data and platform engineers Established warehouse team
Platform on-call General application on-call only Existing platform on-call Data-platform on-call, limited application-infrastructure capacity
Data-location requirements Basic contractual review Strict, defined deployment boundary Warehouse location already approved
Account model One company, mostly simple membership Custom companies, sub-workspaces, multi-account users Account model already maintained in warehouse
Main priority Rapid setup and learning Control, customization, long retention Account analytics and replay with limited new operations

Capacity calculation for Team B

Team B estimates:

Events per day =
  18,000 active users
× 45 events
= 810,000 events per day

Its peak assumption is:

Peak events per second =
  1,500 peak concurrent users
× 0.35 events per active user per second
= 525 events per second

If an average compressed semantic event is assumed to be 650 bytes, with 730 days of retention and two retained copies:

Raw retained data =
  650 bytes
× 810,000 events per day
× 730 days
× 2
= 768,690,000,000 bytes
≈ 769 GB in decimal units

That estimate excludes indexes, database metadata, temporary processing space, backups beyond the two assumed copies, exports, and operational headroom.

For an illustrative aggregate design with four projects, 20,000 active entity keys per project, and six analytical grains:

Aggregate rows per day =
  4
× 20,000
× 6
= 480,000 aggregate rows per day

Retaining every daily aggregate row for 730 days would produce:

480,000 × 730 = 350,400,000 rows

That does not prove the design is wrong. It shows why the team must define the actual grains, sparse combinations, rollups, and retention before choosing infrastructure.

If the average compressed recording is assumed to be 1.2 MB:

Replay retained data =
  1.2 MB
× 3,000 recordings per day
× 30 days
× 2
= 216,000 MB
≈ 216 GB in decimal units

Replay size varies substantially with page complexity, duration, capture rules, snapshot behavior, and compression. Team B must measure its application rather than relying on this planning assumption.

Comparative fit

Responsibility comparison showing how managed, self-hosted, warehouse-native, and hybrid product analytics divide collection, storage, modeling, UI, security, upgrades, and on-call work.
Operational ownership changes with the deployment boundary. The companion comparison table presents the same responsibilities in text.
Comparative fit
Model Team A Team B Team C
Managed Strong fit for rapid learning; vendor operates most infrastructure Conditional fit if data location, account model, export, and retention requirements can be met Reasonable for UI and replay, but may duplicate warehouse models
Fully self-hosted Weak fit because the operating burden is large relative to current needs Strong candidate because the team has control requirements and existing operating capability Possible, but creates a new operational stack the team does not want
Warehouse-native Possible later, but requires modeling and UI work without a data team Strong analytical substrate; still requires product UI, replay, and operational application layers Strong fit for canonical event and account models
Hybrid Useful only if a specific privacy or export requirement justifies the added boundary Strong candidate for separating controlled data layers from specialized managed components Strong candidate: warehouse-native analytics plus a separately operated or managed replay/UI layer

Team A: managed analytics is the likely starting point

Team A needs to learn what to measure and whether its product questions are stable. It does not have a data engineer or a dedicated platform owner.

Managed

The team still owns instrumentation, company identity, feature definitions, privacy choices, and analytical validation. The vendor owns most ingestion, storage, upgrades, and platform incidents.

This is the lowest-risk way for Team A to test its measurement model quickly.

Fully self-hosted

The software license may be inexpensive or free, but the team would assume database, worker, backup, upgrade, security, and on-call responsibilities before analytics has proven strategic value.

This is a poor match unless a hard requirement rules out managed processing.

Warehouse-native

The team has no existing warehouse team or transformation practice. Building account models and an internal UI would likely delay learning.

Hybrid

A hybrid design becomes useful only if Team A has a narrow requirement, such as local privacy filtering before sending approved events to a managed service.

Likely decision

Start with managed analytics, maintain portable event and identity contracts, export raw data where practical, and reassess after requirements and volume become predictable.

Team B: self-hosted or hybrid is strategically plausible

Team B has strict data-location requirements, a custom account model, long retention, and engineers who already operate data infrastructure.

Managed

A managed product remains possible only if its deployment boundary, data flows, retention, deletion, exports, account model, and contractual terms satisfy the requirements.

The evaluation must inspect implementation details rather than accept the word “regional” or “enterprise” as sufficient.

Fully self-hosted

Team B can reuse parts of its queue, object storage, warehouse, monitoring, security, and on-call practices. That lowers the marginal operational burden, although it does not eliminate it.

The team still needs to validate:

  • interactive query performance;
  • exact period-level account counts;
  • replay isolation;
  • upgrade behavior;
  • application-layer access controls;
  • deletion propagation;
  • frontend analytical UX;
  • ownership between product, data, and platform teams.

Warehouse-native

The warehouse is a strong location for the durable identity and event model. It can support long retention, historical attributes, and cross-system analysis.

Warehouse-native alone may not provide the interactive investigation interface, Visit navigation, or replay workflow the team needs.

Hybrid

A hybrid architecture could keep collection, identity, raw events, and account models inside Team B’s controlled infrastructure while using a separately operated interface or replay component where requirements permit.

Every boundary needs a documented data contract and incident owner.

Likely decision

Run a production-like self-hosted and hybrid pilot. Test peak ingestion, account filters, period distinct counts, replay, deletion, restoration, upgrades, and on-call procedures. Choose fully self-hosted only if the additional control is worth the measured operational load.

Team C: warehouse-native plus a hybrid experience is the likely fit

Team C already maintains account and user models in its warehouse. It needs B2B product analytics and replay but wants limited additional infrastructure.

Managed

A managed analytics product could provide a polished investigation UI and replay. The risk is duplicated identity, taxonomy, and account logic between the managed product and the warehouse.

Fully self-hosted

Running a separate collector, queue, database, workers, cache, application UI, and replay store would add a new operational surface. The team has data-platform capability but not a desire to operate another complete application stack.

Warehouse-native

The warehouse is a natural home for Team C’s semantic events, membership history, company attributes, and long-term aggregates.

The team must still solve interactive product UX and replay.

Hybrid

Team C can keep canonical structured events and account analytics in the warehouse while using a managed or narrowly self-hosted replay and product-analytics interface. Shared stable IDs allow the UI to link an aggregate signal to the relevant company, user, Visit, or recording.

Likely decision

Use the warehouse for durable events and account models, then pilot a hybrid investigation and replay layer. Avoid copying every raw interaction into every system without a defined purpose.

What the example demonstrates

The same software can be sensible for Team B and a distraction for Team A.

The decision changes with:

  • existing infrastructure;
  • internal expertise;
  • hard control requirements;
  • event and replay volume;
  • retention;
  • custom B2B modeling;
  • interactive UX expectations;
  • willingness to provide long-term on-call support.

Plan migration and exit before adoption

An exit strategy protects both managed and self-hosted implementations.

Raw-event export

Confirm that accepted events can be exported in a durable, documented format with:

  • stable event IDs;
  • occurrence and receipt timestamps;
  • project context;
  • user and company IDs;
  • schema versions;
  • source;
  • event properties;
  • deletion or correction records.

Schema portability

Keep the business meaning of events outside one vendor UI.

Maintain event definitions, owners, versions, validation rules, and examples in a portable registry or repository.

Stable identities

Do not let one analytics product become the only location where users and accounts are merged.

Preserve canonical user IDs, company IDs, membership history, and merge mappings in a durable system.

Historical aggregates

Decide whether the replacement system needs:

  • raw history;
  • modeled Visits;
  • daily metrics;
  • exact period-level results;
  • saved segments;
  • taxonomy history;
  • dashboard snapshots.

Exporting raw events may not recreate an old dashboard if the original identity and transformation logic is missing.

Replay compatibility

Replay formats, snapshots, asset handling, compression, and player behavior may not be portable between systems.

Treat replay migration as a separate workstream. It may be more practical to retain the old player for a limited period while new recordings use the replacement pipeline.

Vendor lock-in and custom extensions

Lock-in can exist in:

  • proprietary event models;
  • calculated properties;
  • identity merges;
  • replay formats;
  • dashboard definitions;
  • alerting;
  • saved segments;
  • custom plugins;
  • undocumented transformations.

Open source improves inspectability and modification rights under its license, but custom extensions can also make future upgrades and migrations harder.

Review the applicable license and obligations with qualified counsel. Do not treat source availability as a substitute for license review.

Data deletion

Document how the old and new systems will process deletion requests during a migration. Avoid creating an unmanaged historical export that bypasses the original retention policy.

Parallel run

Run the old and new systems together for a defined validation period.

Compare:

  • accepted and rejected event counts;
  • duplicate handling;
  • company and user identities;
  • Visit boundaries;
  • current and previous periods;
  • exact distinct companies and users;
  • timezone boundaries;
  • late events;
  • product taxonomy;
  • saved segments;
  • replay links;
  • deletion outcomes;
  • query latency.

Result parity

Parity does not mean every number must match before definitions are aligned. First document whether each system uses the same:

  • event population;
  • identity model;
  • eligibility rules;
  • sessionization;
  • timezone;
  • late-event cutoff;
  • taxonomy version;
  • approximation policy.

Differences without an explanation are a migration blocker.

Rollback

Define how collection can be returned to the previous path without losing event IDs, creating duplicates, or violating deletion and retention rules.

The most durable exit asset is a stable event and identity model that remains independent of one analytics UI.

When self-hosting may fit

Self-hosted product analytics may be a good fit when several of the following are true:

  • strict data-location or infrastructure-control requirements;
  • an existing platform and data-engineering function;
  • a need for custom B2B account or membership modeling;
  • substantial and reasonably predictable volume;
  • long retention that fits existing storage infrastructure;
  • deep integration with internal identity or analytical systems;
  • an established open-source strategy;
  • a requirement to inspect or extend the application;
  • willingness to own upgrades, backups, security, and on-call support;
  • analytics infrastructure is considered a strategic internal capability.

These conditions justify an evaluation. They do not guarantee that self-hosting will have a lower TCO.

When managed analytics may fit

Managed analytics may be the stronger choice when:

  • the team is small;
  • requirements are still changing;
  • rapid deployment is important;
  • analytics infrastructure is not a core capability;
  • there is no data or platform on-call function;
  • customization requirements are limited;
  • the team needs a finished analytical UI more than infrastructure control;
  • current event and replay volume is uncertain;
  • the organization would rather purchase operational responsibility than build it.

Managed should still be evaluated for identity, export, retention, privacy, access control, deletion, and exit requirements.

Useful hybrid patterns

Structured events in a warehouse with a managed product UI

Keep canonical events and account models in the warehouse while using a managed application for exploration and workflows.

Self-hosted analytics with managed replay

Operate semantic analytics internally and send only approved replay data to a specialized service when policy permits.

Managed ingestion with raw export

Use managed collection and operational processing while continuously exporting durable raw events to controlled storage.

Self-hosted identity and filtering with managed processing

Resolve account context and remove disallowed data locally before approved events cross the service boundary.

Short detailed retention and long aggregate retention

Keep raw events and replay for the period needed for investigation, then retain lower-volume aggregates for long-term trends.

The architecture should reflect explicit requirements. Do not create a hybrid merely to avoid choosing an owner.

A practical decision framework

Use the following process before committing to managed, self-hosted, warehouse-native, or hybrid analytics.

1. Define the analytical decisions

List the product, customer-success, UX, and leadership decisions the system must support.

Avoid starting with “collect everything.”

2. Estimate event and query volume

Model average and peak ingestion, raw-event size, replay, retention, projects, filters, concurrent dashboards, exports, and backfills.

3. Define the B2B identity model

Document companies, operating groups, users, memberships, service accounts, impersonation, anonymous activity, merges, and historical changes.

4. Define the product taxonomy

Specify normalized pages, grouped pages, product areas, meaningful events, rule ownership, and history.

5. Identify privacy and data-location requirements

Map every data path, processor, region, backup, log, export, and administrative access route.

6. Inventory existing platform capability

Identify infrastructure, warehouse, security, observability, backup, on-call, and frontend capabilities that can actually be reused.

7. Calculate full TCO

Include infrastructure, labor, data-quality work, security, governance, incidents, upgrades, and opportunity cost for every option.

8. Define reliability expectations

Specify acceptable event loss, data delay, query availability, recovery objectives, deletion timing, and support coverage.

9. Evaluate staffing and on-call ownership

Name the owners before selecting the architecture.

10. Test managed, self-hosted, and hybrid options

Compare implementation boundaries and operating responsibility, not only feature checklists.

11. Run a production-like pilot

Use representative event schemas, account distributions, replay, peak traffic, retention jobs, filters, concurrent users, and failure scenarios.

12. Validate correctness and performance

Reconcile raw events, identities, Visits, daily metrics, period distinct counts, previous-period comparisons, and dashboard results.

13. Define migration, exit, and long-term ownership

Document exports, parity tests, rollback, upgrade policy, recovery, and the people responsible after launch.

Common mistakes

1. Comparing license cost with subscription price

This ignores infrastructure, maintenance, on-call, data quality, security, upgrades, and opportunity cost.

2. Treating raw-event storage as a complete analytics product

Raw data does not provide identity correctness, Visits, product taxonomy, aggregates, interactive queries, or an investigation UI.

3. Ignoring company and membership modeling

User-only analytics can hide champion concentration, multi-account behavior, and low adoption across the rest of a customer account.

4. Summing daily distinct counts

The same company or user can appear on multiple days. Period-level distinct totals require deduplication across the full period or mergeable distinct states.

5. Sending replay through the ordinary event path without planning

Replay can have different volume, retention, compression, privacy, storage, and failure priorities.

6. Choosing a database before defining the queries

The correct storage design depends on the required filters, distinct counts, retention, concurrency, and investigative detail.

7. Collecting every interaction

Unbounded capture increases storage, cardinality, privacy exposure, and analytical noise without guaranteeing better decisions.

8. Having no retention policy

“Keep it forever” creates compounding cost, security exposure, and deletion complexity.

9. Assuming self-hosting guarantees privacy

Privacy depends on capture scope, configuration, access, backups, logs, dependencies, and operations.

10. Underestimating frontend and analytical UX work

A query result is not yet a product. Teams need definitions, filters, comparisons, source links, loading states, error handling, and accessible visualizations.

11. Failing to plan upgrades

Database migrations, worker compatibility, schema changes, dependency updates, and custom extensions require testing and rollback.

12. Having no on-call owner

A service without an owner can remain silently stale or incorrect even while its web page loads.

13. Ignoring export and migration

Waiting until cancellation or an incident to discover export limitations makes the exit more expensive.

14. Measuring average traffic instead of peak load

Launches, imports, retries, and automated workflows can exceed the daily average by a large margin.

15. Failing to validate dashboard parity

A successful deployment does not prove that identity, eligibility, Visit, taxonomy, and distinct-count logic are correct.

How Hymetry approaches open-source B2B product analytics

Hymetry is account-centric product intelligence for B2B SaaS. Its model connects product behavior across Pages, Companies, Users, and session-level evidence so teams can investigate adoption in the context of customer accounts rather than only global user totals.

The open-source edition is a self-hosted product analytics and session replay application. At the time of this article’s source review, Hymetry’s public repository documents:

  • Pages;
  • Companies;
  • Users;
  • session analytics;
  • screen recording;
  • AI-assisted page-structure naming;
  • manual page rules;
  • Docker Compose deployment;
  • a Render deployment option;
  • a Django and Python application;
  • PostgreSQL;
  • Redis and Celery;
  • rrweb-based recording;
  • GNU AGPLv3-or-later licensing.

The integration should identify both the individual user and the company whenever possible. That identity lets page activity connect to the account and people behind it.

Hymetry’s product structure distinguishes:

Raw URLs
→ page rules
→ grouped pages
→ product areas

That structure supports feature- and workflow-level analysis without treating every dynamic URL as a separate product concept.

Companies provide account context. Users show the people behind account-level behavior. Session analytics and recording provide evidence when a page, company, or user pattern needs investigation.

Current public open-source documentation also describes an optional workspace-level OpenAI key for AI-assisted page naming. Analytics, ingestion, recording, and manual page rules do not require that key. The documented open-source AI capability here is page naming; it should not be read as confirmation that every hosted AI Insights capability is included.

At this review date, the repository says its main branch remains under development and does not support upgrading an existing open-source database. Evaluators should plan a fresh database rather than assume an in-place upgrade path. The self-hosted edition is community-supported.

Do not imply that the open-source edition removes infrastructure work. A self-hosting team remains responsible for deployment, databases, workers, storage, retention, security, backups, updates, monitoring, and support. Do not imply that every hosted capability exists in the open-source edition unless current documentation confirms it.

For the broader analytical model, see B2B Product Analytics: Account-Level Metrics That Matter.

Frequently asked questions

Is open-source product analytics free?

The software may be available without a commercial license fee, but the operating system is not free. Infrastructure, storage, backups, monitoring, engineering, security, upgrades, data-quality work, and on-call support all contribute to TCO.

Does self-hosting guarantee product analytics data ownership or privacy?

No. Self-hosting can provide more control over deployment and storage, but privacy depends on what is captured, where every copy goes, who can access it, how it is protected, and how retention and deletion are operated.

Can PostgreSQL alone support product analytics?

It can support many application and analytical workloads, particularly at modest scale with a suitable model, indexes, partitioning, and aggregates. There is no universal volume threshold. Test representative ingestion, filters, distinct counts, retention, and concurrency before deciding whether another analytical store is necessary.

When is warehouse-native product analytics a better fit?

It is a strong candidate when the company already has reliable event, identity, account, governance, and transformation infrastructure in a warehouse. The team must still decide how users will explore behavior, inspect Visits, review replay, and receive responsive product-specific queries.

How many events justify self-hosting?

There is no universal event threshold. Event volume is only one input. Data-location requirements, retention, replay, cardinality, query complexity, existing infrastructure, staffing, and managed pricing all affect the decision.

Can daily aggregates be used for longer periods?

Yes, when the metric is additive or the aggregate preserves a mergeable state. Finalized daily distinct-user or distinct-company counts must not simply be added to produce a longer-period distinct total.

Should semantic analytics and replay use the same pipeline?

They can share project, company, user, Visit, and authentication context. Separate collection, queue, storage, retention, and failure handling are often useful because replay has different volume and privacy characteristics.

What should a production-like pilot test?

Test representative peak ingestion, retries, duplicates, late events, account filters, high-cardinality properties, Visit construction, exact distinct counts, replay, concurrent dashboards, retention, deletion, backups, restoration, upgrades, failures, and on-call response.

What is the most important protection against lock-in?

Preserve a durable event and identity model independent of one UI. Stable IDs, documented schemas, membership history, taxonomy definitions, raw export, and parity tests make later migration substantially more manageable.

Sources

Source review date: 4 August 2026. Hymetry functionality, documentation, repository route, deployment notes, license, and source URLs were re-verified for publication.

Hymetry

Collection and event pipelines

Storage, aggregation, and query design

Cost and capacity methodology

Security, privacy, backup, and incident response

Session replay and licensing

About Hymetry

Hymetry is account-centric product intelligence for B2B SaaS. It helps teams understand how customer companies and the users inside them adopt and use their product.